📊 US500 Weekly Chart Analysis
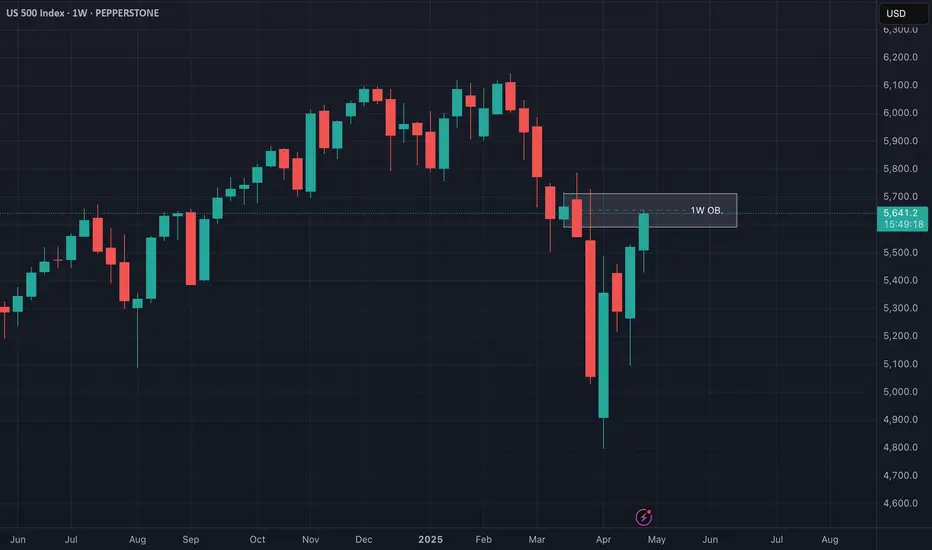
Taking a close look at the US500 on the weekly timeframe, we can see price has now traded directly into a bearish weekly order block 🧱 — a key distribution zone where smart money activity often emerges. At this level, the market is trading at a premium 💰 and appears to be overextended 📈.
⚠️ From a risk management standpoint, I’d advise extreme caution — the current conditions could set the stage for a sharp retracement, especially as we approach week’s end. This level aligns with areas where institutional players may look to offload risk or reverse exposure.
🔁 A potential pullback from here would not be surprising, given the elevated context and technical structure.
📚 This breakdown is for educational purposes only and should not be considered financial advice.
🚀 Winning Scalping Strategy To Beat Market Chaos: ✅ 🚀
👀 🔗 youtu.be/4aI23mzOLJE
🚀 Trade Signals For Your PROP FIRM CHALLENGE: 🔥💰
👀 🔗 youtu.be/nWD69sSxRUM
👉Join Our Free DISCORD:
🔗 discord.com/invite/PcBeCdwVQq
👀 🔗 youtu.be/4aI23mzOLJE
🚀 Trade Signals For Your PROP FIRM CHALLENGE: 🔥💰
👀 🔗 youtu.be/nWD69sSxRUM
👉Join Our Free DISCORD:
🔗 discord.com/invite/PcBeCdwVQq
Declinazione di responsabilità
Le informazioni ed i contenuti pubblicati non costituiscono in alcun modo una sollecitazione ad investire o ad operare nei mercati finanziari. Non sono inoltre fornite o supportate da TradingView. Maggiori dettagli nelle Condizioni d'uso.