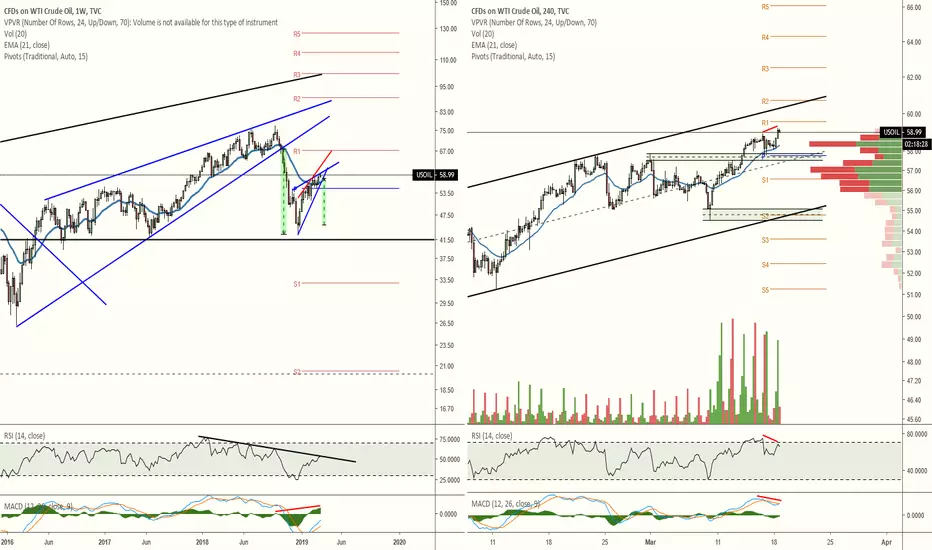
Weekly chart shows price nearing the apex of the ascending wedge with a target of $45. RSI is hitting resistance and MACD's histogram is possibly printing hidden bearish divergence.
H4 chart shows RSI, and possibly MACD, printing bearish divergence. The nearby demand has already been tapped once making it much easier for the next drop into it to potentially fall further. I would watch for the demand below that at around $55 to provide some support. It also aligns with the ascending channel's support. If that support cannot hold then, based on the height of the ascending channel, we should be looking at $49.70/$50 for the next likely support. That target is a mere $5 away from the weekly breakdown target.
H4 chart shows RSI, and possibly MACD, printing bearish divergence. The nearby demand has already been tapped once making it much easier for the next drop into it to potentially fall further. I would watch for the demand below that at around $55 to provide some support. It also aligns with the ascending channel's support. If that support cannot hold then, based on the height of the ascending channel, we should be looking at $49.70/$50 for the next likely support. That target is a mere $5 away from the weekly breakdown target.
Declinazione di responsabilità
Le informazioni ed i contenuti pubblicati non costituiscono in alcun modo una sollecitazione ad investire o ad operare nei mercati finanziari. Non sono inoltre fornite o supportate da TradingView. Maggiori dettagli nelle Condizioni d'uso.
Declinazione di responsabilità
Le informazioni ed i contenuti pubblicati non costituiscono in alcun modo una sollecitazione ad investire o ad operare nei mercati finanziari. Non sono inoltre fornite o supportate da TradingView. Maggiori dettagli nelle Condizioni d'uso.
