Visa (V) Buy Signal – Multi-Timeframe Confirmation 🚀📈
Visa Inc. (V) V is showing a fresh buy opportunity when viewed through the lens of the 3-step trading system: candlesticks, oscillators, and moving averages across different timeframes.
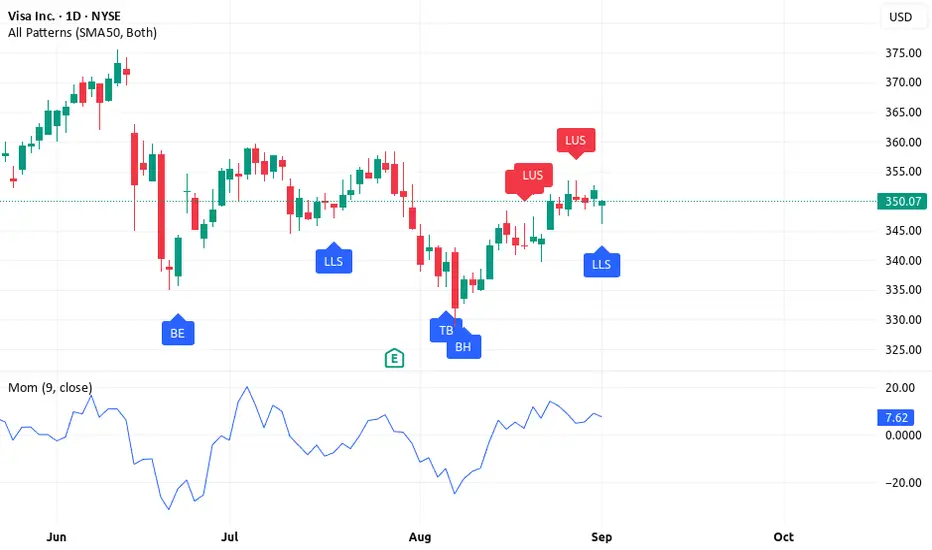
Step 1 – Daily Candlestick: Bullish Rejection
On the daily chart, Visa has printed bullish candlestick signals — including long lower shadows that show buyers stepping in to defend support. This suggests
demand is strong at lower levels and the path of least resistance remains upward.
Step 2 – Weekly Oscillators: Strong Sell / Sell
Interestingly, the weekly oscillator rating is currently on Sell / Strong Sell, showing momentum weakness in the short term. This isn’t necessarily bearish
for long-term buyers — in fact, it often signals a pullback inside a broader uptrend, giving traders the chance to accumulate at discounted levels.
Step 3 – Monthly Moving Averages: Strong Buy / Buy
The monthly moving average rating is firmly Strong Buy / Buy, confirming that Visa is in a long-term bullish trend. As long as price stays above these key levels,
the primary trend remains intact and pullbacks should be viewed as opportunities, not threats.
The Buy Case for Visa
This alignment creates a classic buy setup: a strong trend supported by long-term moving averages, a temporary dip in weekly momentum, and a bullish candlestick trigger on the daily chart.
Trade Idea: Traders may consider long entries near current levels or on dips, with protective stops below recent daily lows. Profit targets could be staged at previous swing highs and beyond, in line with the monthly uptrend.
⚠️ Disclaimer: This analysis is for educational purposes only and not financial advice. Trading and investing carry risks. Before risking real money, it’s
recommended to practice on a demo account and develop solid risk management and profit-taking strategies.
Visa Inc. (V)
Step 1 – Daily Candlestick: Bullish Rejection
On the daily chart, Visa has printed bullish candlestick signals — including long lower shadows that show buyers stepping in to defend support. This suggests
demand is strong at lower levels and the path of least resistance remains upward.
Step 2 – Weekly Oscillators: Strong Sell / Sell
Interestingly, the weekly oscillator rating is currently on Sell / Strong Sell, showing momentum weakness in the short term. This isn’t necessarily bearish
for long-term buyers — in fact, it often signals a pullback inside a broader uptrend, giving traders the chance to accumulate at discounted levels.
Step 3 – Monthly Moving Averages: Strong Buy / Buy
The monthly moving average rating is firmly Strong Buy / Buy, confirming that Visa is in a long-term bullish trend. As long as price stays above these key levels,
the primary trend remains intact and pullbacks should be viewed as opportunities, not threats.
The Buy Case for Visa
- Daily Candlestick → Bullish rejection signals buyers defending support.
- Weekly Oscillators → Short-term weakness creating entry opportunities.
- Monthly Moving Averages → Long-term bullish trend remains intact.
This alignment creates a classic buy setup: a strong trend supported by long-term moving averages, a temporary dip in weekly momentum, and a bullish candlestick trigger on the daily chart.
Trade Idea: Traders may consider long entries near current levels or on dips, with protective stops below recent daily lows. Profit targets could be staged at previous swing highs and beyond, in line with the monthly uptrend.
⚠️ Disclaimer: This analysis is for educational purposes only and not financial advice. Trading and investing carry risks. Before risking real money, it’s
recommended to practice on a demo account and develop solid risk management and profit-taking strategies.
Pubblicazioni correlate
Declinazione di responsabilità
Le informazioni ed i contenuti pubblicati non costituiscono in alcun modo una sollecitazione ad investire o ad operare nei mercati finanziari. Non sono inoltre fornite o supportate da TradingView. Maggiori dettagli nelle Condizioni d'uso.
Pubblicazioni correlate
Declinazione di responsabilità
Le informazioni ed i contenuti pubblicati non costituiscono in alcun modo una sollecitazione ad investire o ad operare nei mercati finanziari. Non sono inoltre fornite o supportate da TradingView. Maggiori dettagli nelle Condizioni d'uso.