Formazione
Selezione editoriale
How "Whales" Manipulate Markets: A Trader's Guide to Succeed

Every chart tells a story of institutional footprints. For most, it's chaotic noise. But when you understand the market's true engine — the constant need of "Smart Money" to capture vast amounts of liquidity to fill their orders — that noise turns into a clear map.
This guide will teach you to read that map. We will break down the main types of manipulation and show you how to use them to identify high-probability zones for potential entries.
So, why exactly is liquidity the fuel for these "Smart Money" players, which for simplicity, we'll call "Whales"? It's because a Whale holds the largest volume of funds in a specific asset and, unlike retail traders like us, it cannot open its huge position at any given moment simply because there aren't enough buy or sell offers on the market.
To fill its orders, the Whale constantly carries out manipulations to capture additional liquidity. This isn't about deception or anything negative—it's how the market constantly forms its movements, how whales achieve their goals by moving from one liquidity pool to another, much like whales in the ocean hunt for plankton to get vital energy for long journeys from one feeding ground to another.
Why will these principles of price movement through manipulation, which worked decades ago, continue to work forever? Because human nature doesn't change over time. The crowd is always driven by greed and fear, making it easy to manipulate. Therefore, manipulation is often the motive for the birth of a future move and is a key element in market mechanics. If you understand these mechanics, you will be able to see the footprints of whales on any chart and not only minimize your chances of becoming their food but also join their next move to get your share of the profit in the boundless ocean of market opportunities.

Let's take a closer look at how whales carry out their manipulations and classify their types.
The Whale is constantly in hedged positions. To fill its large-sum orders without impacting the price, it uses the principles of Sell to Buy (STB) and Buy to Sell (BTS).
The STB manipulation is used to accumulate long positions. To do this, the Whale opens an opposing short position, activating stop orders and liquidations of buyers, purchasing their positions at a favorable price. It also encourages other retail participants, especially breakout traders, to open short positions. Continuing to accumulate long positions, the Whale sharply moves the price up, liquidating short participants and absorbing their positions. After the price has moved up, the Whale is left with an open losing position from its short manipulation. To close it at breakeven or a small loss, the Whale needs to return the price back to the zone of its manipulation. This return is called mitigation.

In the opposite case, when the Whale needs to drive an asset's price down, it uses the BTS manipulation. To fill its short positions, the Whale opens a long position, activating stop-losses and forced liquidations of sellers, and encouraging retail breakout traders to also open long positions. Continuing to accumulate short positions, the Whale aggressively moves the price down, absorbing and liquidating the positions of impatient longs. After the downward impulse is complete, the Whale is left with an open losing long position. Just as in the first case, to close it at zero or a small loss, the Whale needs to return the price to the manipulation zone, after which another markdown of the asset occurs, and the cycle can be repeated as many times as necessary.

Thus, through manipulation, the Whale achieves two goals at once:
Most of the time, the price movement between manipulations is unpredictable. Entering during this movement, for example, in the middle or end of an impulse or within a range, increases the chances that you will become a victim of the next manipulation and liquidity for the Whale. However, if you wait for the price to arrive at the manipulation zone, also known as a Point of Interest (POI), and ensure that the Whale acknowledges this area (i.e., it has stopped there and is beginning a reversal), the probability of choosing the correct direction for a trade will be on your side.
To help you recognize manipulation zones, let's look at their different types.
🔹 Order Block (OB) - A down candle (sometimes 2, rarely 3 candles) before an impulsive move up (in the case of a bullish OB), or an up candle (sometimes 2, rarely 3 candles) before an impulsive move down (in the case of a bearish OB). In most cases, this short, sharp move should sweep some form of significant liquidity. An additional confirmation of an Order Block is the immediate imbalance or Fair Value Gap (FVG) that follows it, because the Whale's intensive position accumulation and the associated impulse move don't allow enough time for all market participants' orders to be filled.


🔹 Demand/Supply Zones are similar in principle to Order Blocks but differ in that they have a more prolonged action, which can consist of many up or down candles, making these zones often significantly wider than OBs.
Demand Zone - The last downward move before an intensive rally.

Supply Zone - The last upward move before an intensive drop.

Often, an Order Block can be found inside a Demand/Supply zone.

🔹 Range - Also a manipulation zone and essentially an Order Block, but unlike an OB, this manipulation can last for a very long time when the Whale lacks sufficient liquidity from a quick manipulation and accumulates its large position by collecting internal and external liquidity through the range. Ranges, just like Order Blocks and Demand/Supply zones, are points of interest for the Whale to close its losing hedged positions and continue moving towards its goals.

Conditions for Applying and Validity of Manipulation Zones
Due to the fractal nature of market charts, manipulations can be seen on any timeframe. On weekly and daily timeframes, manipulation zones can be used for swing trading or investment purchases. 4-hour and 1-hour timeframes will show potential entries from manipulations for intraday trading or holding positions for several days. 5-minute and 1-minute timeframes will show manipulations in the form of order flow for final entry confirmation.

Whatever type of analysis you use for your trading, understanding the nature of market manipulations and practicing their recognition will allow you to be one step ahead of most market participants and open your trades with an understanding of which way institutional capital is most likely to move next.
~~~~~~~~~~~~~~~~~~~~~~~~~~~~~~~~~~~~~~~~~~~~~~~~~~~~~~~~~~~~~~~~~
If you found this guide helpful, support it with a Boost! 🚀
Have a question or a "lightbulb moment" from this article? Share it in the comments! I read every single one. 💬
► Follow me on TradingView for more educational content like this and to not miss my next detailed trade idea.
~~~~~~~~~~~~~~~~~~~~~~~~~~~~~~~~~~~~~~~~~~~~~~~~~~~~~~~~~~~~~~~~~
This guide will teach you to read that map. We will break down the main types of manipulation and show you how to use them to identify high-probability zones for potential entries.
So, why exactly is liquidity the fuel for these "Smart Money" players, which for simplicity, we'll call "Whales"? It's because a Whale holds the largest volume of funds in a specific asset and, unlike retail traders like us, it cannot open its huge position at any given moment simply because there aren't enough buy or sell offers on the market.
To fill its orders, the Whale constantly carries out manipulations to capture additional liquidity. This isn't about deception or anything negative—it's how the market constantly forms its movements, how whales achieve their goals by moving from one liquidity pool to another, much like whales in the ocean hunt for plankton to get vital energy for long journeys from one feeding ground to another.
Why will these principles of price movement through manipulation, which worked decades ago, continue to work forever? Because human nature doesn't change over time. The crowd is always driven by greed and fear, making it easy to manipulate. Therefore, manipulation is often the motive for the birth of a future move and is a key element in market mechanics. If you understand these mechanics, you will be able to see the footprints of whales on any chart and not only minimize your chances of becoming their food but also join their next move to get your share of the profit in the boundless ocean of market opportunities.
Let's take a closer look at how whales carry out their manipulations and classify their types.
The Whale is constantly in hedged positions. To fill its large-sum orders without impacting the price, it uses the principles of Sell to Buy (STB) and Buy to Sell (BTS).
The STB manipulation is used to accumulate long positions. To do this, the Whale opens an opposing short position, activating stop orders and liquidations of buyers, purchasing their positions at a favorable price. It also encourages other retail participants, especially breakout traders, to open short positions. Continuing to accumulate long positions, the Whale sharply moves the price up, liquidating short participants and absorbing their positions. After the price has moved up, the Whale is left with an open losing position from its short manipulation. To close it at breakeven or a small loss, the Whale needs to return the price back to the zone of its manipulation. This return is called mitigation.
In the opposite case, when the Whale needs to drive an asset's price down, it uses the BTS manipulation. To fill its short positions, the Whale opens a long position, activating stop-losses and forced liquidations of sellers, and encouraging retail breakout traders to also open long positions. Continuing to accumulate short positions, the Whale aggressively moves the price down, absorbing and liquidating the positions of impatient longs. After the downward impulse is complete, the Whale is left with an open losing long position. Just as in the first case, to close it at zero or a small loss, the Whale needs to return the price to the manipulation zone, after which another markdown of the asset occurs, and the cycle can be repeated as many times as necessary.
Thus, through manipulation, the Whale achieves two goals at once:
- It gets the most favorable price.
- It eliminates most of its competitors by liquidating their positions with an opposing move.
Most of the time, the price movement between manipulations is unpredictable. Entering during this movement, for example, in the middle or end of an impulse or within a range, increases the chances that you will become a victim of the next manipulation and liquidity for the Whale. However, if you wait for the price to arrive at the manipulation zone, also known as a Point of Interest (POI), and ensure that the Whale acknowledges this area (i.e., it has stopped there and is beginning a reversal), the probability of choosing the correct direction for a trade will be on your side.
To help you recognize manipulation zones, let's look at their different types.
🔹 Order Block (OB) - A down candle (sometimes 2, rarely 3 candles) before an impulsive move up (in the case of a bullish OB), or an up candle (sometimes 2, rarely 3 candles) before an impulsive move down (in the case of a bearish OB). In most cases, this short, sharp move should sweep some form of significant liquidity. An additional confirmation of an Order Block is the immediate imbalance or Fair Value Gap (FVG) that follows it, because the Whale's intensive position accumulation and the associated impulse move don't allow enough time for all market participants' orders to be filled.
🔹 Demand/Supply Zones are similar in principle to Order Blocks but differ in that they have a more prolonged action, which can consist of many up or down candles, making these zones often significantly wider than OBs.
Demand Zone - The last downward move before an intensive rally.
Supply Zone - The last upward move before an intensive drop.
Often, an Order Block can be found inside a Demand/Supply zone.
🔹 Range - Also a manipulation zone and essentially an Order Block, but unlike an OB, this manipulation can last for a very long time when the Whale lacks sufficient liquidity from a quick manipulation and accumulates its large position by collecting internal and external liquidity through the range. Ranges, just like Order Blocks and Demand/Supply zones, are points of interest for the Whale to close its losing hedged positions and continue moving towards its goals.
Conditions for Applying and Validity of Manipulation Zones
- An important condition for applying manipulation zones is that they can only be used once. That is, if the price has come to a zone and reacted to it, upon a second arrival, that zone is no longer valid. For convenience in marking used zones, I shorten them to the point of the first touch so as not to consider them anymore, but to understand which way the order flow is directed—a very important concept that, unlike structure, shows the true direction of the Whale's movement. Order flow is manifested by the price reacting to manipulation zones from below in an uptrend and from above in a downtrend.
- It is also very important to understand that it makes sense to identify and use manipulation zones as one of a trade's entry conditions only from below for an uptrend and from above for a downtrend. Any counter-trend zones formed in the path of a trend are highly likely to be broken and serve as liquidity.
- In ranges, manipulations formed after deviations can be used for entries from both sides.
- Only manipulations that were formed at the beginning of an impulsive price move can be considered valid for entry. That is, they must be the manipulations that directly triggered the start of the move; in Smart Money terminology, they are often called the "origin". Any manipulation in the middle or end of a move will most likely serve as liquidity on the way back to mitigate the origin zone.
- How long does a manipulation zone remain relevant? It remains relevant until a new structural element (a higher high or a lower low) is formed, especially if the price has already come close to the manipulation zone, for example, into the FVG before the zone. This most likely means the Whale has already finished its business there and closed one of its losing hedged positions at a small loss. When the trend changes, such a zone will act as liquidity, not a POI. So, a manipulation zone will not always be mitigated; often, a reversal occurs from the FVG before it. However, entering from an FVG is much less reliable than from an Order Block, Demand/Supply zone, or Range. I personally skip such entries and wait for a new manipulation zone to form and be mitigated; they happen on the market constantly.
- A good bonus that further strengthens the probability of a setup working out during the mitigation of manipulation zones is a liquidity sweep upon reaching them.
- Consider the context and supplementary conditions. Although manipulation zones are the strongest areas for price reversals, they should always be used in conjunction with other supplementary conditions and tools, for example, with Fibonacci retracement levels or liquidity sweeps. "Context" implies any other conditions that can either confirm or contradict the likely direction of price movement. For example: in which phase of correction is the price? For a long, safe entries can only be considered from the discount zone (below the 50% Fib level); for shorts, only from the premium zone (above the 50% Fib level). Is there significant, un-swept liquidity nearby, such as previous daily, weekly, or monthly highs/lows, or an untouched Asian session high/low? What upcoming news could affect the asset and hit the stop before the setup plays out? At what time of day did the price mitigate the manipulation? Taking context into account is a crucial and integral part of analysis in the search for entry points.
Due to the fractal nature of market charts, manipulations can be seen on any timeframe. On weekly and daily timeframes, manipulation zones can be used for swing trading or investment purchases. 4-hour and 1-hour timeframes will show potential entries from manipulations for intraday trading or holding positions for several days. 5-minute and 1-minute timeframes will show manipulations in the form of order flow for final entry confirmation.
Whatever type of analysis you use for your trading, understanding the nature of market manipulations and practicing their recognition will allow you to be one step ahead of most market participants and open your trades with an understanding of which way institutional capital is most likely to move next.
~~~~~~~~~~~~~~~~~~~~~~~~~~~~~~~~~~~~~~~~~~~~~~~~~~~~~~~~~~~~~~~~~
If you found this guide helpful, support it with a Boost! 🚀
Have a question or a "lightbulb moment" from this article? Share it in the comments! I read every single one. 💬
► Follow me on TradingView for more educational content like this and to not miss my next detailed trade idea.
~~~~~~~~~~~~~~~~~~~~~~~~~~~~~~~~~~~~~~~~~~~~~~~~~~~~~~~~~~~~~~~~~
Nota
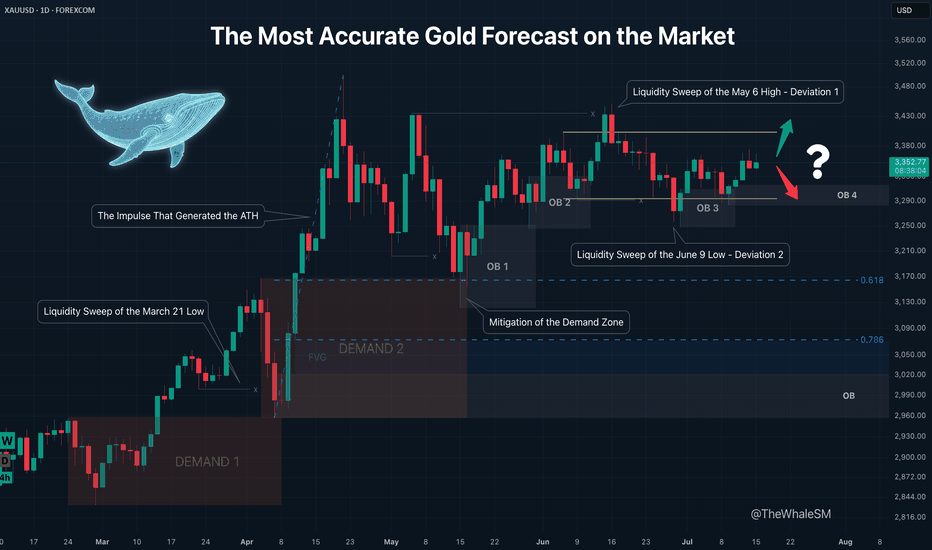
If you’re curious how this logic works in practice, take a look at this trade idea — it’s a direct continuation of the analysis in this article.I go deeper into the same daily Gold chart shown above and explain how the structure and manipulation zones formed step by step.
The title carries a bit of irony — you’ll see why halfway through this publication 😉
Check out the full breakdown here:
🚀 Get my Institutional Trade Setups & Watchlist.
Stop guessing. Get the exact Levels, POIs & Trade Plans I am watching daily.
Exclusive for my community.
► Get Free Access:
thewhalesm.com
Stop guessing. Get the exact Levels, POIs & Trade Plans I am watching daily.
Exclusive for my community.
► Get Free Access:
thewhalesm.com
Declinazione di responsabilità
Le informazioni e le pubblicazioni non sono intese come, e non costituiscono, consulenza o raccomandazioni finanziarie, di investimento, di trading o di altro tipo fornite o approvate da TradingView. Per ulteriori informazioni, consultare i Termini di utilizzo.