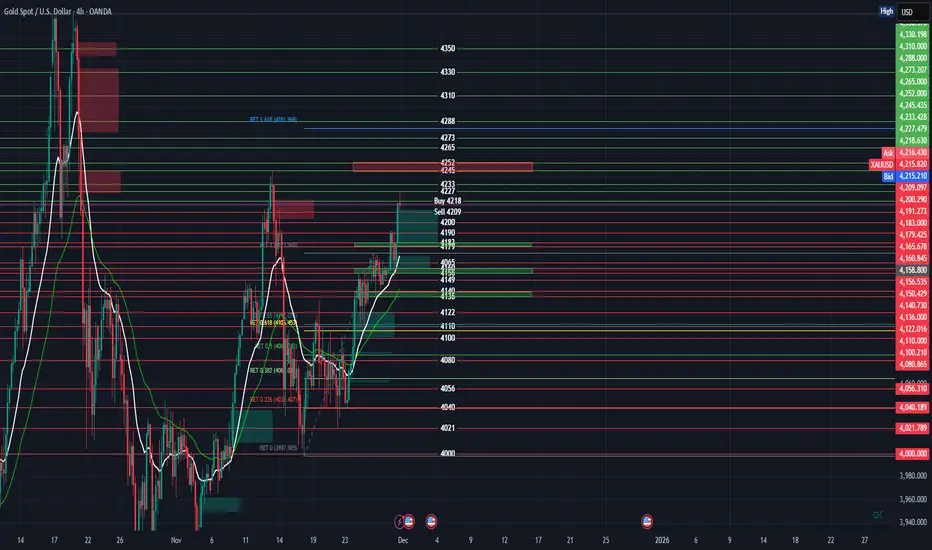
Chart Overview: XAU/USD 4-Hour
Current Trend: The market is in a corrective phase (bearish pullback) following an aggressive parabolic rally to a high of ~4381.
Momentum: Bearish. The White Moving Average (likely a shorter period, e.g., 20 or 50) has crossed below the Green Moving Average (likely a longer period, e.g., 200), signaling downward momentum.
🔴 Potential Sell Entries (Red Zones)
Major Resistance / Supply Zone: 4245.00 - 4252.00
Technicals: This red shaded box represents a Bearish Order Block (Supply Zone). Price previously broke down from this level with impulsive red candles, leaving trapped buyers. When price retraces to this area, these buyers often sell to break even, and institutional sellers reload shorts.
Secondary Sell signal (Text on chart): The label "Sell 4209" suggests a breakout trade. If price loses the 4209 local support, it confirms a continuation of the lower-low structure.
Suggested Take Profits (TP):
TP 1: 4165 (First Green Zone)
TP 2: 4136 (Second Green Zone)
TP 3: 4105 (0.618 Fibonacci Golden Pocket)
🟢 Potential Buy Entries (Green Zones)
Zone 1: 4160.00 - 4165.00
Technicals: This is the first area of structural support. It aligns with previous consolidation tops before the massive breakout. It acts as a "flip zone" (resistance turned support).
Zone 2: 4136.00 - 4140.00 (Stronger Support)
Technicals: This is a stronger Demand Zone. It sits just above the significant Fibonacci levels. If the correction deepens, this is the area where institutional algorithms often step in to defend the larger uptrend.
Text Signal "Buy 4218": The label "Buy 4218" on your chart suggests a momentum reversal trade—essentially waiting for the price to reclaim the immediate resistance before going long.
Suggested Take Profits (TP):
TP 1: 4210 (Local deviation)
TP 2: 4245 (Testing the bottom of the Red Supply Zone)
TP 3: 4280 (continuation of trend)
Summary Strategy
Short Term: The bias is Bearish as long as price is below the Moving Average crossover. Look for rejections at the 4245 red box to Sell.
Medium Term: Watch for bullish reversal patterns (doji, hammer candles) inside the green 4136 - 4165 zones to catch the next leg up of the macro bull run.
Trade attivo
Buy running 436 pipsPubblicazioni correlate
Declinazione di responsabilità
Le informazioni e le pubblicazioni non sono intese come, e non costituiscono, consulenza o raccomandazioni finanziarie, di investimento, di trading o di altro tipo fornite o approvate da TradingView. Per ulteriori informazioni, consultare i Termini di utilizzo.
Pubblicazioni correlate
Declinazione di responsabilità
Le informazioni e le pubblicazioni non sono intese come, e non costituiscono, consulenza o raccomandazioni finanziarie, di investimento, di trading o di altro tipo fornite o approvate da TradingView. Per ulteriori informazioni, consultare i Termini di utilizzo.