Current Price Movement:
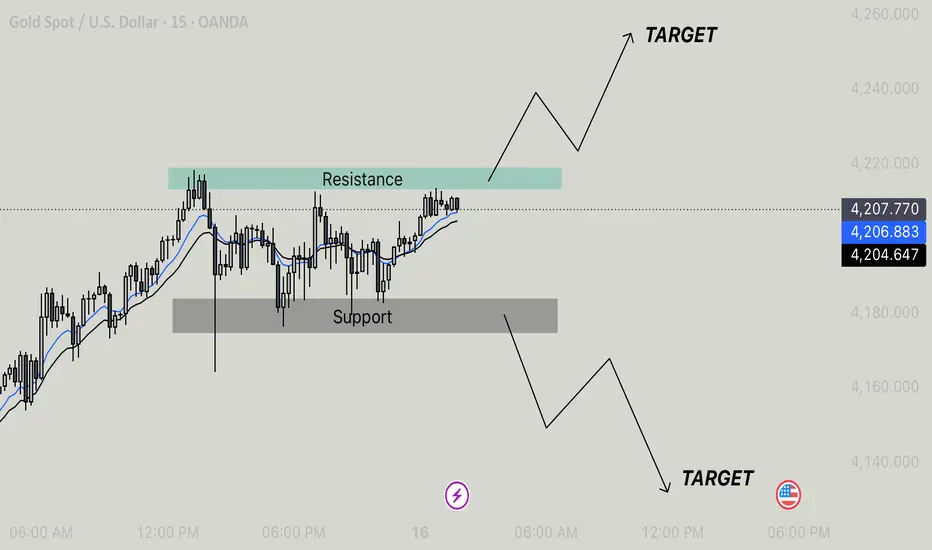
The price is fluctuating just above the Support zone (marked in gray) and near the Resistance zone (marked in green). It’s oscillating between these two zones, suggesting a consolidation phase or a potential breakout.
Resistance and Support Levels:
Resistance is indicated by the green area, where price has previously faced upward rejection. If the price breaks this resistance level, it could signify further bullish movement.
Support is marked by the gray area, suggesting that if the price drops to this level, it has historically found buying interest, preventing further downward movement.
Price Target:
The chart marks target points above and below the current price levels. The arrows indicate expected price movement. The top arrow suggests an upward target if the price breaks above resistance, while the bottom arrow indicates a downward target if the price falls through support.
Trend Indication:
There is a slight upward trend in the price, as seen in the shape of the moving averages. This could indicate bullish momentum, but the market remains in a range (bound by support and resistance).
Key Focus for Traders:
Traders should monitor if the price breaks through the resistance or support levels. A breakout from the range could lead to a sharp move in the direction of the breakout.
Depending on how the price reacts at the support and resistance levels. Keep an eye on the breakout direction to confirm the next move.
Declinazione di responsabilità
Le informazioni ed i contenuti pubblicati non costituiscono in alcun modo una sollecitazione ad investire o ad operare nei mercati finanziari. Non sono inoltre fornite o supportate da TradingView. Maggiori dettagli nelle Condizioni d'uso.
Declinazione di responsabilità
Le informazioni ed i contenuti pubblicati non costituiscono in alcun modo una sollecitazione ad investire o ad operare nei mercati finanziari. Non sono inoltre fornite o supportate da TradingView. Maggiori dettagli nelle Condizioni d'uso.