Hi ladies.
If you are using tons of tools to identify supply/support and demand/resistances zones. STOP.
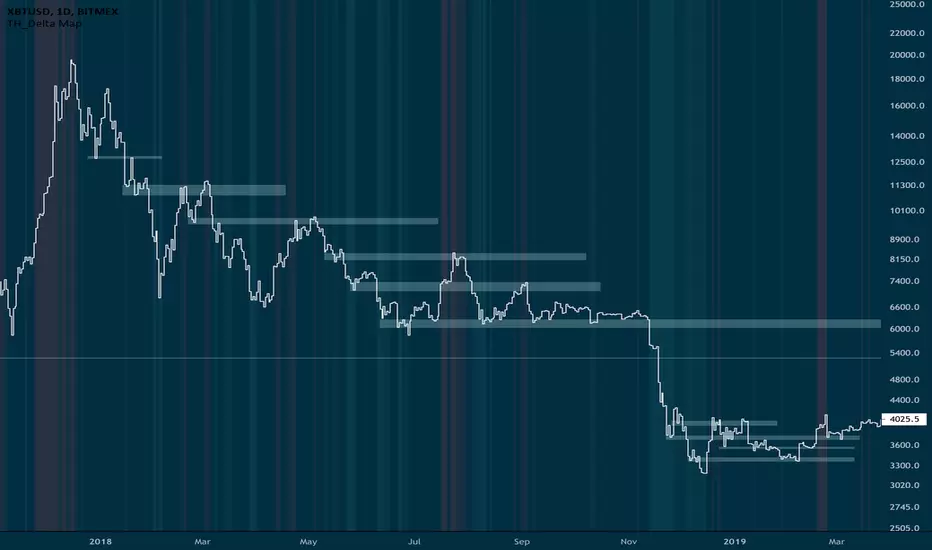
All you need is to apply this simple approach using past price action.
Switch to line chart on M, W and Daily timeframes and identify the Lower closes where price bounces. Map the zone to the left et voila.
All these zones are likely to represent important resistance zones in the future once price goes under them again. We can also look into zones with higher volume signatures which give higher significance to these resistances as well as consolidated sideway at those lows.
Best.
TH
If you are using tons of tools to identify supply/support and demand/resistances zones. STOP.
All you need is to apply this simple approach using past price action.
Switch to line chart on M, W and Daily timeframes and identify the Lower closes where price bounces. Map the zone to the left et voila.
All these zones are likely to represent important resistance zones in the future once price goes under them again. We can also look into zones with higher volume signatures which give higher significance to these resistances as well as consolidated sideway at those lows.
Best.
TH
D7R
Declinazione di responsabilità
Le informazioni e le pubblicazioni non sono intese come, e non costituiscono, consulenza o raccomandazioni finanziarie, di investimento, di trading o di altro tipo fornite o approvate da TradingView. Per ulteriori informazioni, consultare i Termini di utilizzo.
D7R
Declinazione di responsabilità
Le informazioni e le pubblicazioni non sono intese come, e non costituiscono, consulenza o raccomandazioni finanziarie, di investimento, di trading o di altro tipo fornite o approvate da TradingView. Per ulteriori informazioni, consultare i Termini di utilizzo.