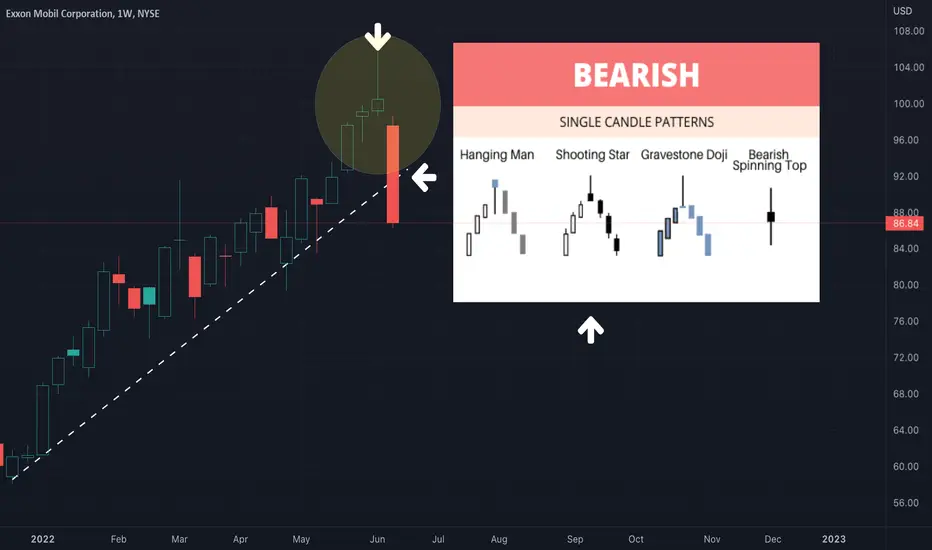
The weekly candles for the oil and gas company, ExxonMobil, look quite bearish. This could be the start of a major decline. There is a shooting star pattern forming on the weekly chart, while the oscillators are trending down and while the daily EMA exp ribbon and daily trend lines breaking down. Although anything can happen, it is looking like a major bearish reversal is occurring. It's sad that just last week all the "expert analysts" at CNBC were making strong bullish calls about energy stocks, citing "free cash flow" and numerous other reasons to buy them, all the while the charts are showing a topping pattern in energy and commodities. This is usually when tops form - when there is no bearish sentiment among anyone, and when strong hands are selling to weak hands. At least charts do not lie, and thanks to TradingView anyone can access them alongside a plethora of crowd-sourced scripts and indicators.
Nota
To support my work:
patreon.com/SpyMasterTrades
To subscribe to my YouTube channel:
youtube.com/@SpyMasterTrades
To follow me on X:
twitter.com/SpyMasterTrades
To tip me (BTC wallet):
bc1qvh48429042mdwvdthwlufx072g3ftffcts2q03
patreon.com/SpyMasterTrades
To subscribe to my YouTube channel:
youtube.com/@SpyMasterTrades
To follow me on X:
twitter.com/SpyMasterTrades
To tip me (BTC wallet):
bc1qvh48429042mdwvdthwlufx072g3ftffcts2q03
Declinazione di responsabilità
Le informazioni ed i contenuti pubblicati non costituiscono in alcun modo una sollecitazione ad investire o ad operare nei mercati finanziari. Non sono inoltre fornite o supportate da TradingView. Maggiori dettagli nelle Condizioni d'uso.