🔍1. Trend and Key Levels
General trend
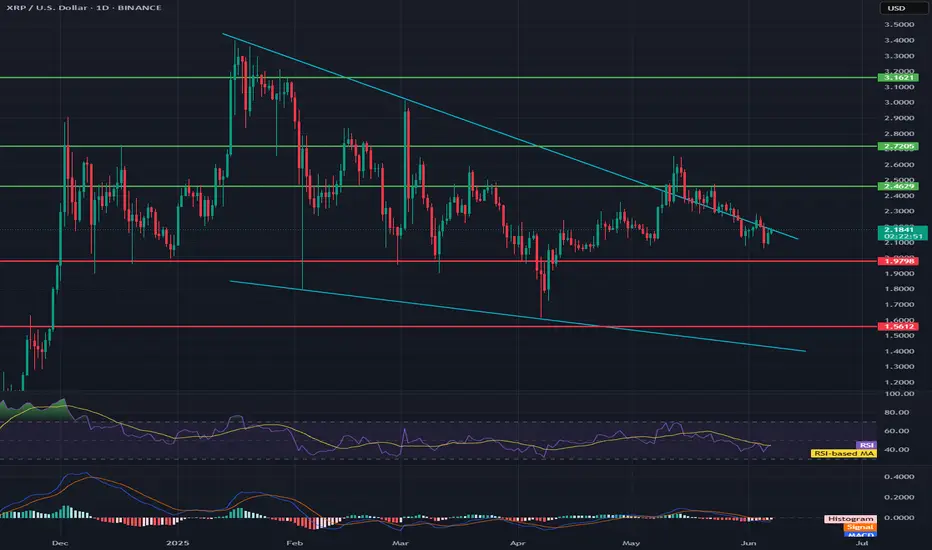
In the medium term: We see a clear downtrend, marked by two wide blue trend lines (the upper line from the peak around $3.3, the lower from the local lows).
Recent weeks: Consolidation in a wide range between $2.72 and $1.98, with frequent attempts to break out.
📌2. Support and resistance levels
Green lines (resistance):
$3.16 — the historical peak of this wave, very strong resistance.
$2.72 — another strong resistance, around which the price was rejected several times.
$2.46 — local resistance, currently the price is below this level.
Red lines (support):
$1.98 — very important support, tested several times already.
$1.56 — lower support, coinciding with the lower line of the downtrend channel.
3. Market formations and structure
Declining channel: Wide channel marked by two blue lines. Price is moving in its lower half.
Short-term descending triangle: Visible at current levels – local peaks are getting lower, and support is around USD 1.98.
Volume: Volume advantage visible on descending candles.
📊4. Indicators
RSI
Currently around 40 — No clear advantage of the buyer side, slightly below the neutral zone. RSI does not give a signal of overbought or oversold.
RSI-based MA — Oscillates below the level of 50, which confirms the downtrend.
MACD
MAD and signal lines are below zero, without clear divergence.
Histogram: Slight advantage of bears – there is no signal to reverse the trend yet.
🧠5. Near-term scenarios
Bullish
Condition: Breakout above the local downtrend line (~$2.20–$2.25) and return above $2.46.
Target: $2.72 (test of resistance), further move possible to $3.16 in case of strong gains.
Bearish
Condition: Breakout and close below $1.98.
Target: $1.56 (main channel support), and even lower – lower channel line.
Sideways scenario
Further consolidation possible in the range of $2.46–$1.98, until a breakout from this range occurs.
📊6. Sentiment and summary
Medium-term trend: Down.
Buyers are weak, RSI low, MACD does not give a rebound signal yet.
Key level to watch: 1.98 USD – if it falls, the next stop is 1.56 USD.
Only a return above 2.46 USD may give the first signals of a trend change.
🧠Recommendation
For long-term players: Be careful, do not blindly catch the bottom.
For speculators: Play for a rebound only with a short stop below 1.98 USD.
For investors: Wait for a signal confirming a breakout from the channel or a clear divergence on the indicators.
General trend
In the medium term: We see a clear downtrend, marked by two wide blue trend lines (the upper line from the peak around $3.3, the lower from the local lows).
Recent weeks: Consolidation in a wide range between $2.72 and $1.98, with frequent attempts to break out.
📌2. Support and resistance levels
Green lines (resistance):
$3.16 — the historical peak of this wave, very strong resistance.
$2.72 — another strong resistance, around which the price was rejected several times.
$2.46 — local resistance, currently the price is below this level.
Red lines (support):
$1.98 — very important support, tested several times already.
$1.56 — lower support, coinciding with the lower line of the downtrend channel.
3. Market formations and structure
Declining channel: Wide channel marked by two blue lines. Price is moving in its lower half.
Short-term descending triangle: Visible at current levels – local peaks are getting lower, and support is around USD 1.98.
Volume: Volume advantage visible on descending candles.
📊4. Indicators
RSI
Currently around 40 — No clear advantage of the buyer side, slightly below the neutral zone. RSI does not give a signal of overbought or oversold.
RSI-based MA — Oscillates below the level of 50, which confirms the downtrend.
MACD
MAD and signal lines are below zero, without clear divergence.
Histogram: Slight advantage of bears – there is no signal to reverse the trend yet.
🧠5. Near-term scenarios
Bullish
Condition: Breakout above the local downtrend line (~$2.20–$2.25) and return above $2.46.
Target: $2.72 (test of resistance), further move possible to $3.16 in case of strong gains.
Bearish
Condition: Breakout and close below $1.98.
Target: $1.56 (main channel support), and even lower – lower channel line.
Sideways scenario
Further consolidation possible in the range of $2.46–$1.98, until a breakout from this range occurs.
📊6. Sentiment and summary
Medium-term trend: Down.
Buyers are weak, RSI low, MACD does not give a rebound signal yet.
Key level to watch: 1.98 USD – if it falls, the next stop is 1.56 USD.
Only a return above 2.46 USD may give the first signals of a trend change.
🧠Recommendation
For long-term players: Be careful, do not blindly catch the bottom.
For speculators: Play for a rebound only with a short stop below 1.98 USD.
For investors: Wait for a signal confirming a breakout from the channel or a clear divergence on the indicators.
Declinazione di responsabilità
Le informazioni ed i contenuti pubblicati non costituiscono in alcun modo una sollecitazione ad investire o ad operare nei mercati finanziari. Non sono inoltre fornite o supportate da TradingView. Maggiori dettagli nelle Condizioni d'uso.
Declinazione di responsabilità
Le informazioni ed i contenuti pubblicati non costituiscono in alcun modo una sollecitazione ad investire o ad operare nei mercati finanziari. Non sono inoltre fornite o supportate da TradingView. Maggiori dettagli nelle Condizioni d'uso.