ZM | Long Setup | Range-to-Trend Re-Rate on AI UCaaS/CCaaS Pivot | Nov 24, 2025
🔹 Thesis Summary
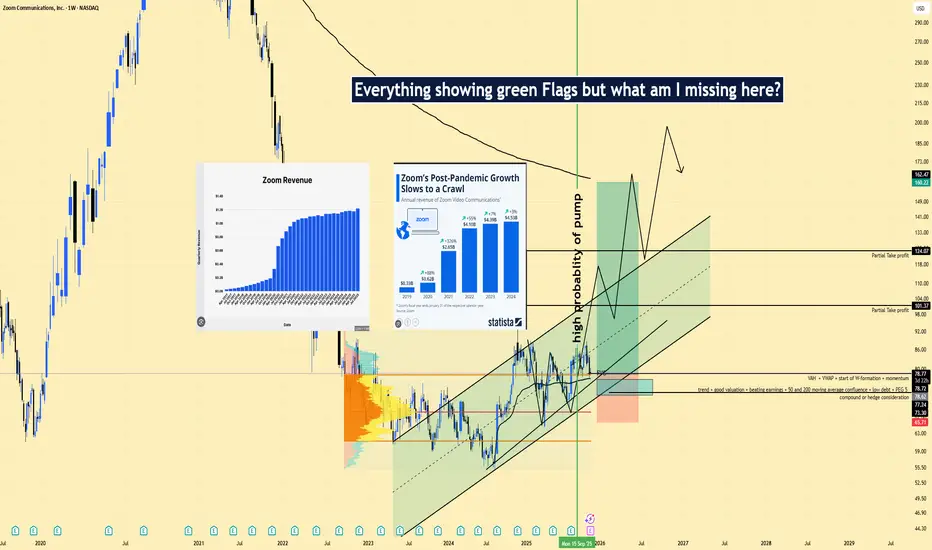
Zoom is exiting a two-year base and riding a rising channel as the mix shifts from “meetings” to a broader AI-enabled UCaaS/CCaaS stack. If growth stabilizes and margins hold, a multiple re-rate from ~13x fwd EPS is plausible into 2026.
🔹 Trade Setup
Bias: Long
Entry Zone: $76–$81 (value area/POC ≈ $79)
Stop Loss: $68.5 (below channel base & prior swing lows)
Take-Profits:
TP1: $101.4
TP2: $118.5
TP3: $124.1
Max Target: $160–$165
🔹 Narrative & Context
Structure: Weekly rising channel since 2023 with a completed W-formation; price keeps reclaiming the VAH ~ $79 with positive reactions near value area lows.
Quality of sponsor base: ~77% institutional ownership with >1,000 holders; consistent EPS beats on the most recent quarters and revenue holding near $1.1–$1.2B/qtr.
Product mix shift: Zoom Phone + Contact Center (CCaaS) + AI Companion reduce dependence on commoditized meetings and increase seat/ARPU durability.
Seasonality/flow: 2025 YTD underperformed vs. 2023–2024; mean-reversion tailwind into Dec–Jan is typical for profitable software after weak YTD prints.
🔹 Valuation & Context (Pro Metrics, framed simply)
Forward P/E ≈ 13.3x vs. large-cap software ~24–28x → market prices Zoom like a no-growth asset → if CCaaS/Phone sustain mid-single-digit top-line and stable margins, the discount can narrow—this is the re-rate upside.
P/FCF ≈ 12.8x vs peers high-teens to 20s → cheaper cash generation → supports buybacks and tuck-ins during the pivot.
Quality: ROE ~13.6% / ROIC ~13.2%, Quick Ratio ~4.4 → solid balance sheet, self-funded transition.
Growth: EPS past 5Y +106%, Sales past 5Y +49.6% → post-pandemic decel but still compounding; stability matters more than acceleration for a re-rate.
Risk: Debt/Equity ~0.0x → low leverage limits downside in macro shocks.
🔹 Contrarian Angle (Your Edge)
Consensus still frames ZM as a stagnant “meetings” play. The tape shows accumulation within an ascending channel and improving mix economics. A shift from 13x → 18–20x fwd on steady EPS supports $120–$160 over the next 12–18 months—well above many cautious targets.
🔹 Risks (balanced)
Earnings gap risk & guide sensitivity (event tonight) could pierce the stop before trend resumes.
Competitive bundling from MSFT/GOOGL pressuring seat growth and pricing.
Execution risk scaling CCaaS/AI while protecting margins and security posture.
🔹 Macro Considerations
NDX / 10-Year yields: ZM correlates with duration-sensitive software—lower yields aid the re-rate; rising DXY/yields would cap multiples.
IT spending cadence: Enterprise budget resets (Q1CY) and procurement softness could stall seat adds.
Volatility/hedging: Elevated IV around earnings; consider staged entries or collars/call-spreads if taking exposure into the print.
🔹 Bottom Line
ZM screens inexpensive on forward and FCF multiples with a strong balance sheet and a credible path to mix-led stabilization. The weekly structure offers a defined-risk long from value, aiming for a re-rating toward $120–$160 as CCaaS/AI execution compounds.
🔹 Forward Path
If this post gains traction, I’ll follow up with: (1) weekly/quarterly re-maps of the channel and volume shelves, (2) updates on breakout/invalidations vs. $97/$101/$118/$124, (3) commentary on post-earnings guide and margin cadence.
Like & Follow for structured ideas, not signals. I post high-conviction setups here before broader narratives play out.
⚠️ Disclaimer: This is not financial advice. Always do your own research. Charts and visuals may include AI enhancements.
🔹 Footnote
Forward P/E: Price divided by expected earnings over the next 12 months. Lower = cheaper relative to profits.
P/FCF (Price-to-Free-Cash-Flow): Price vs. the cash left after investments. A measure of efficiency.
FCF Yield: Free cash flow per share ÷ price per share. Higher = more cash returned for each dollar invested.
ROE (Return on Equity): Net income ÷ shareholder equity. Shows management efficiency with investor capital.
ROIC (Return on Invested Capital): Net income ÷ all invested capital (equity + debt). A purer profitability gauge.
Debt/Equity: Debt divided by equity. <1 usually means balance sheet is conservative.
R:R (Risk-to-Reward): Ratio of expected upside vs. downside. 3:1 = you risk $1 to make $3.
🔹 Thesis Summary
Zoom is exiting a two-year base and riding a rising channel as the mix shifts from “meetings” to a broader AI-enabled UCaaS/CCaaS stack. If growth stabilizes and margins hold, a multiple re-rate from ~13x fwd EPS is plausible into 2026.
🔹 Trade Setup
Bias: Long
Entry Zone: $76–$81 (value area/POC ≈ $79)
Stop Loss: $68.5 (below channel base & prior swing lows)
Take-Profits:
TP1: $101.4
TP2: $118.5
TP3: $124.1
Max Target: $160–$165
🔹 Narrative & Context
Structure: Weekly rising channel since 2023 with a completed W-formation; price keeps reclaiming the VAH ~ $79 with positive reactions near value area lows.
Quality of sponsor base: ~77% institutional ownership with >1,000 holders; consistent EPS beats on the most recent quarters and revenue holding near $1.1–$1.2B/qtr.
Product mix shift: Zoom Phone + Contact Center (CCaaS) + AI Companion reduce dependence on commoditized meetings and increase seat/ARPU durability.
Seasonality/flow: 2025 YTD underperformed vs. 2023–2024; mean-reversion tailwind into Dec–Jan is typical for profitable software after weak YTD prints.
🔹 Valuation & Context (Pro Metrics, framed simply)
Forward P/E ≈ 13.3x vs. large-cap software ~24–28x → market prices Zoom like a no-growth asset → if CCaaS/Phone sustain mid-single-digit top-line and stable margins, the discount can narrow—this is the re-rate upside.
P/FCF ≈ 12.8x vs peers high-teens to 20s → cheaper cash generation → supports buybacks and tuck-ins during the pivot.
Quality: ROE ~13.6% / ROIC ~13.2%, Quick Ratio ~4.4 → solid balance sheet, self-funded transition.
Growth: EPS past 5Y +106%, Sales past 5Y +49.6% → post-pandemic decel but still compounding; stability matters more than acceleration for a re-rate.
Risk: Debt/Equity ~0.0x → low leverage limits downside in macro shocks.
🔹 Contrarian Angle (Your Edge)
Consensus still frames ZM as a stagnant “meetings” play. The tape shows accumulation within an ascending channel and improving mix economics. A shift from 13x → 18–20x fwd on steady EPS supports $120–$160 over the next 12–18 months—well above many cautious targets.
🔹 Risks (balanced)
Earnings gap risk & guide sensitivity (event tonight) could pierce the stop before trend resumes.
Competitive bundling from MSFT/GOOGL pressuring seat growth and pricing.
Execution risk scaling CCaaS/AI while protecting margins and security posture.
🔹 Macro Considerations
NDX / 10-Year yields: ZM correlates with duration-sensitive software—lower yields aid the re-rate; rising DXY/yields would cap multiples.
IT spending cadence: Enterprise budget resets (Q1CY) and procurement softness could stall seat adds.
Volatility/hedging: Elevated IV around earnings; consider staged entries or collars/call-spreads if taking exposure into the print.
🔹 Bottom Line
ZM screens inexpensive on forward and FCF multiples with a strong balance sheet and a credible path to mix-led stabilization. The weekly structure offers a defined-risk long from value, aiming for a re-rating toward $120–$160 as CCaaS/AI execution compounds.
🔹 Forward Path
If this post gains traction, I’ll follow up with: (1) weekly/quarterly re-maps of the channel and volume shelves, (2) updates on breakout/invalidations vs. $97/$101/$118/$124, (3) commentary on post-earnings guide and margin cadence.
Like & Follow for structured ideas, not signals. I post high-conviction setups here before broader narratives play out.
⚠️ Disclaimer: This is not financial advice. Always do your own research. Charts and visuals may include AI enhancements.
🔹 Footnote
Forward P/E: Price divided by expected earnings over the next 12 months. Lower = cheaper relative to profits.
P/FCF (Price-to-Free-Cash-Flow): Price vs. the cash left after investments. A measure of efficiency.
FCF Yield: Free cash flow per share ÷ price per share. Higher = more cash returned for each dollar invested.
ROE (Return on Equity): Net income ÷ shareholder equity. Shows management efficiency with investor capital.
ROIC (Return on Invested Capital): Net income ÷ all invested capital (equity + debt). A purer profitability gauge.
Debt/Equity: Debt divided by equity. <1 usually means balance sheet is conservative.
R:R (Risk-to-Reward): Ratio of expected upside vs. downside. 3:1 = you risk $1 to make $3.
I work with busy founders and executives who are tired of ad hoc trading results. I give you a clear, rules based trading system built from my own years in the market, so you can protect capital, compound it, and understand trading like a real business.
Declinazione di responsabilità
Le informazioni e le pubblicazioni non sono intese come, e non costituiscono, consulenza o raccomandazioni finanziarie, di investimento, di trading o di altro tipo fornite o approvate da TradingView. Per ulteriori informazioni, consultare i Termini di utilizzo.