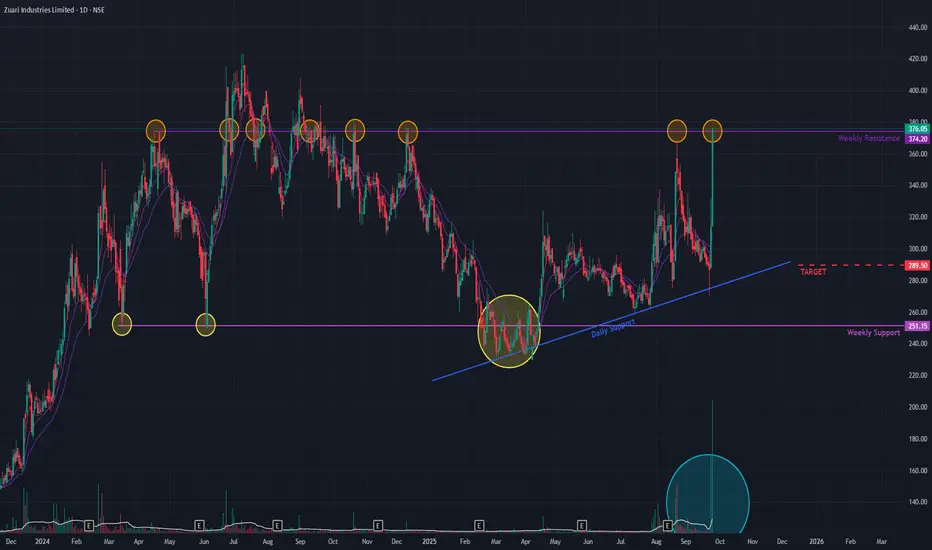
Zuari Industries has decisively broken out of a prolonged consolidation phase, signaling a significant shift in momentum. Over the past two trading sessions, the stock has surged an incredible +29.72%, a move backed by a massive volume spike that validates the breakout from a key horizontal resistance level in place since April 2024. The stock closed today at ₹376.04, hitting the 20% upper circuit.
This breakout appears more decisive than previous "fakeouts" due to the sheer force of the move and the exceptionally high volume. Furthermore, the strong closing candle, with its high and close being nearly identical, suggests intense buying pressure and a willingness for participants to push the price even higher.
Comprehensive Bullish Confirmation 👍
The bullish outlook is strongly supported by a rare alignment of positive indicators across all major timeframes:
- Multi-Timeframe Strength: Both the short-term Exponential Moving Averages (EMAs) and the Relative Strength Index (RSI) are indicating strong bullish crossovers on the monthly, weekly, and daily charts.
- Volume Thrust: The breakout was driven by enormous trading volume, indicating a high level of conviction and institutional participation.
Outlook and Key Levels
This powerful breakout has potentially initiated a new uptrend. The price action in the coming days will be crucial to confirm that buyers can absorb any profit-taking and hold the breakout level.
- Bullish Case 📈: If the current momentum is sustained, the next logical price target is the resistance zone near ₹497.
- Bearish Case 📉: Should the breakout fail and momentum reverse, the stock could pull back to find support near the previous resistance (now support) level of ₹289.
Disclaimer: This analysis is my personal view & for educational purposes only. They shall not be construed as trade or investment advice. Before making any financial decision, it is imperative that you consult with a qualified financial professional.
Declinazione di responsabilità
Le informazioni e le pubblicazioni non sono intese come, e non costituiscono, consulenza o raccomandazioni finanziarie, di investimento, di trading o di altro tipo fornite o approvate da TradingView. Per ulteriori informazioni, consultare i Termini di utilizzo.