Powerful Setup & Art of the Pullback: Supply & Demand Concept
📊 Supply & Demand View 📊
When you look closely, supply and demand zones are essentially the fingerprints of institutional activity. Big players rarely dump or buy entire positions in one shot—they stagger their trades, leaving behind identifiable imbalances on the charts. Every time price revisits these zones, it tends to react sharply.
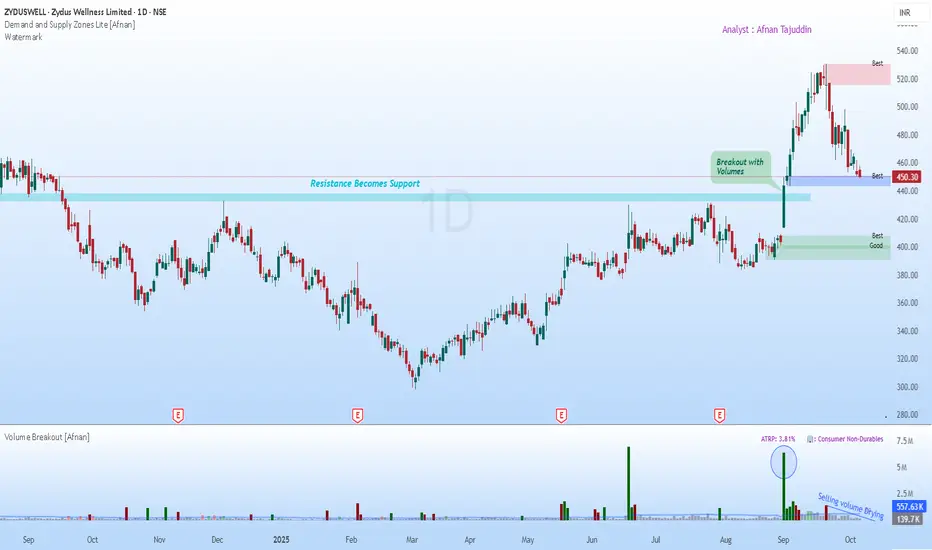
Take Zydus Wellness as a clear example of this dynamic. After an impressive rally to a fresh all-time high, a predictable wave of profit-taking emerged, carving out a new supply zone at the top. This is the moment where sellers stepped in decisively, nudging prices down in a healthy correction. These zones aren’t just lines or boxes on a chart—they mark areas where significant buying or selling has historically occurred, often foreshadowing price reversals.
Now here’s where it gets interesting: price is at strong demand zone, And this isn’t just any support level—this is the very origin of the rally that shattered all previous resistance and propelled the stock to its highs. Areas like this tend to hold clusters of unfilled buy orders, meaning a return to this level often triggers a meaningful bounce as buyers re-enter the fray.
🚀 Classical Chart View 🚀
From a more traditional technical lens, the story remains bullish. The chart highlights a key resistance that had capped price for some time. When this level finally broke, it wasn’t subtle—volume spiked, signaling strong conviction from major market participants.
This is a textbook “resistance becomes support” scenario. The price is now retesting this old barrier. What makes this retest particularly noteworthy is the noticeable drop in selling volume during the pullback. This drying of volume suggests sellers are losing momentum, making it more likely that the pause is temporary rather than a reversal. The convergence of this retested resistance with a high-quality demand zone creates a compelling setup for the next move higher.
✨ Final Takeaway ✨
Both perspectives are telling a consistent story. Supply and demand analysis highlights a prime zone for buyers to re-engage, while classical technical confirm the strength of the underlying trend. The price has already found a foothold at the Best Quality Demand Zone, which could very well act as the springboard for the next leg of the rally. For anyone considering a position, a stop-loss below 430 provides a sensible buffer beneath this structural support.
💡 Risk Management Reminder 💡
Even the cleanest setups aren’t guarantees. Stick to your risk rules, size positions carefully, and maintain a disciplined stop-loss. Remember—the goal is to protect capital, not to perfectly predict the market.
🔄 Patience and discipline win more often than bold predictions. 🔄
This analysis is for educational purposes only and should not be interpreted as trading advice. I’m not a SEBI-registered analyst.
When you look closely, supply and demand zones are essentially the fingerprints of institutional activity. Big players rarely dump or buy entire positions in one shot—they stagger their trades, leaving behind identifiable imbalances on the charts. Every time price revisits these zones, it tends to react sharply.
Take Zydus Wellness as a clear example of this dynamic. After an impressive rally to a fresh all-time high, a predictable wave of profit-taking emerged, carving out a new supply zone at the top. This is the moment where sellers stepped in decisively, nudging prices down in a healthy correction. These zones aren’t just lines or boxes on a chart—they mark areas where significant buying or selling has historically occurred, often foreshadowing price reversals.
Now here’s where it gets interesting: price is at strong demand zone, And this isn’t just any support level—this is the very origin of the rally that shattered all previous resistance and propelled the stock to its highs. Areas like this tend to hold clusters of unfilled buy orders, meaning a return to this level often triggers a meaningful bounce as buyers re-enter the fray.
🚀 Classical Chart View 🚀
From a more traditional technical lens, the story remains bullish. The chart highlights a key resistance that had capped price for some time. When this level finally broke, it wasn’t subtle—volume spiked, signaling strong conviction from major market participants.
This is a textbook “resistance becomes support” scenario. The price is now retesting this old barrier. What makes this retest particularly noteworthy is the noticeable drop in selling volume during the pullback. This drying of volume suggests sellers are losing momentum, making it more likely that the pause is temporary rather than a reversal. The convergence of this retested resistance with a high-quality demand zone creates a compelling setup for the next move higher.
✨ Final Takeaway ✨
Both perspectives are telling a consistent story. Supply and demand analysis highlights a prime zone for buyers to re-engage, while classical technical confirm the strength of the underlying trend. The price has already found a foothold at the Best Quality Demand Zone, which could very well act as the springboard for the next leg of the rally. For anyone considering a position, a stop-loss below 430 provides a sensible buffer beneath this structural support.
💡 Risk Management Reminder 💡
Even the cleanest setups aren’t guarantees. Stick to your risk rules, size positions carefully, and maintain a disciplined stop-loss. Remember—the goal is to protect capital, not to perfectly predict the market.
“The art of trading is not about being right all the time, but about losing less when you are wrong.”
🔄 Patience and discipline win more often than bold predictions. 🔄
This analysis is for educational purposes only and should not be interpreted as trading advice. I’m not a SEBI-registered analyst.
Access the powerful Demand and Supply Zone Pro indicator at:
marketup2date.com
Stay updated on Telegram:
t.me/MarketUp2Date
Join our WhatsApp channel:
whatsapp.com/channel/0029Va6ByyH0LKZCc4Az4x0u
marketup2date.com
Stay updated on Telegram:
t.me/MarketUp2Date
Join our WhatsApp channel:
whatsapp.com/channel/0029Va6ByyH0LKZCc4Az4x0u
Declinazione di responsabilità
Le informazioni e le pubblicazioni non sono intese come, e non costituiscono, consulenza o raccomandazioni finanziarie, di investimento, di trading o di altro tipo fornite o approvate da TradingView. Per ulteriori informazioni, consultare i Termini di utilizzo.