Error messages
The if statement is too long
This error occurs when the indented code (local block) inside an `if` structure
is too large for the compiler. Because of how the compiler works, you
won’t receive a message telling you exactly how many lines of code you
are over the limit. The only solution now is to split the structure into smaller parts (functions or smaller if statements).
The example below shows a reasonably lengthy if statement;
theoretically, this would throw line 4: if statement is too long:
To fix this code, you could move these lines into their own function:
Script requesting too many securities
The maximum number of securities in script is limited to 40. If you
declare a variable as a request.security function call and then use
that variable as input for other variables and calculations, it will not
result in multiple request.security calls. But if you will declare a
function that calls request.security --- every call to this function
will count as a request.security call.
It is not easy to say how many securities will be called looking at the
source code. Following example have exactly 3 calls to
request.security after compilation:
Script could not be translated from: null
Usually this error occurs in version 1 Pine scripts, and means that code
is incorrect. Pine Script® of version 2 (and higher) is better at
explaining errors of this kind. So you can try to switch to version 2 by
adding a
special attribute in the first line. You’ll get
line 2: no viable alternative at character '$':
line 2: no viable alternative at character ’$’
This error message gives a hint on what is wrong. $ stands in place of
string with script title. For example:
Mismatched input <…> expecting <???>
Same as no viable alternative, but it is known what should be at that
place. Example:
line 3: mismatched input 'plot' expecting 'end of line without line continuation'
To fix this you should start line with plot on a new line without an
indent:
Loop is too long (> 500 ms)
We limit the computation time of loop on every historical bar and realtime tick to protect our servers from infinite or very long loops. This limit also fail-fast indicators that will take too long to compute. For example, if you’ll have 5000 bars, and indicator takes 500 milliseconds to compute on each of bars, it would have result in more than 16 minutes of loading:
It might be possible to optimize algorithm to overcome this error. In this case, algorithm may be optimized like this:
Script has too many local variables
This error appears if the script is too large to be compiled. A
statement var=expression creates a local variable for var. Apart
from this, it is important to note, that auxiliary variables can be
implicitly created during the process of a script compilation. The limit
applies to variables created both explicitly and implicitly. The
limitation of 1000 variables is applied to each function individually.
In fact, the code placed in a global scope of a script also implicitly
wrapped up into the main function and the limit of 1000 variables
becomes applicable to it. There are few refactorings you can try to
avoid this issue:
can be converted into:
The requested historical offset (X) is beyond the historical buffer’s limit (Y)
Pine scripts calculate on every bar on the chart, sequentially, left to right, maintaining a historical buffer of values. When a script needs to use a value from a previous bar, it takes that value from the buffer. If a script tries to access a value from a bar further back than the historical buffer extends, it throws this error.
As a simple example, if your code includes a line like plot(myVar[500]), the script keeps a buffer of the last 500 historical values of the myVar variable. This buffer ensures that on every execution, the myVar variable has access to its value 500 bars before the current one.
Pine creates the historical buffer in a way that minimizes issues:
- Initially, the script calculates the historical buffers based on the data from the first several hundred bars. If historical offsets are constant, or if future offsets are not greater than the offsets found during this calculation, the script works without issues. The example above does not cause any issues because the variable is called in the global scope with a constant offset of 500. On the first iteration of the script, it is clear that the buffer size needs to be 500.
- If the script requests a value outside the buffer during calculation on historical data, the script tries to adjust the buffer to a proper length automatically. The script increases the buffer and restarts. This can happen several times until either the re-run limit is reached or the script calculates without the error.
The error can still appear on historical data, but is more likely to occur on realtime data, which is not covered by automatic buffer detection. For example, the following script works when the user first adds it to the chart, but fails with an error when the first realtime tick arrives. This behaviour can be replicated consistently by turning on the Bar Replay feature and pressing Step Forward once. This happens because on historical data, we request close[500], which establishes the size of the historical buffer as 500. When we request close[1000] on the first realtime bar, the script returns an error because the requested value is outside the buffer:
To fix this, we need to ensure the historical buffer of our variable (in this case, close) is always large enough.
The following sections describe different methods to ensure that the historical buffer is of a sufficient size.
Potential fixes
Use the max_bars_back() function
The max_bars_back() function sets the size of the historical buffer for a particular variable. To fix the issue in the example script above, we need to ensure the buffer for close is at least 1000:
Use the max_bars_back parameter of the indicator() or strategy() function
The max_bars_back parameter of the indicator() and strategy() functions provides a handy way to increase the historical buffer for all the variables inside of the script. However, increasing the historical buffer for all variables without a specific need for it negatively impacts performance. Using the max_bars_back() function is preferable because it is more precise and more performant.
Use the maximum value manually on history to force a proper buffer size
Another way to set a specific historical buffer is to call the variable on historical data with the maximum buffer required, regardless of whether it’s needed or not at the moment. For example, the script below assigns the myVar variable a close[1000] value on the very first bar of the dataset. It makes no practical difference — on the first bar, all past values are na — but because of this change, the script sets the variable’s buffer to 1000 and can then work on realtime bars without issues:
Max bars back with Pine drawings
A common reason for the historical offset error is creating drawings that are drawn on realtime data, but extend into the past. For example, the code below runs into the runtime error as soon as the first realtime tick arrives:
When the example indicator above is calculating on historical data, it does not draw any lines, and so does not call the time series at all. In this case, the time series takes the default buffer size of 300. On realtime bars, we then request the bar_index[500] value, which is converted into time[500] by the function. But the script doesn’t have a large enough historical buffer, which causes the error to appear.
In these cases, the historical buffer for the time series must be enlarged, even if the drawing functions use bar_index exclusively. The easiest fix is to call the max_bars_back() function on the time series, to ensure that its buffer is large enough:
Memory limits exceeded
The most common cause of this error is the retrieval of objects and collections from request.*() functions such as request.security(). Other possible causes include unnecessary drawing updates, excess historical buffer capacity, or inefficient use of max_bars_back().
Returning collections from request.*() functions
The “Memory limits exceeded” error most often occurs when a script uses request.*() functions to retrieve objects or collections from another symbol or timeframe.
When requesting data from other contexts, the data for each bar is copied and stored in memory to allow the script to reference it later in the main context. This can use a lot of memory, depending on the data. Requesting large collections can easily lead to excessive memory consumption.
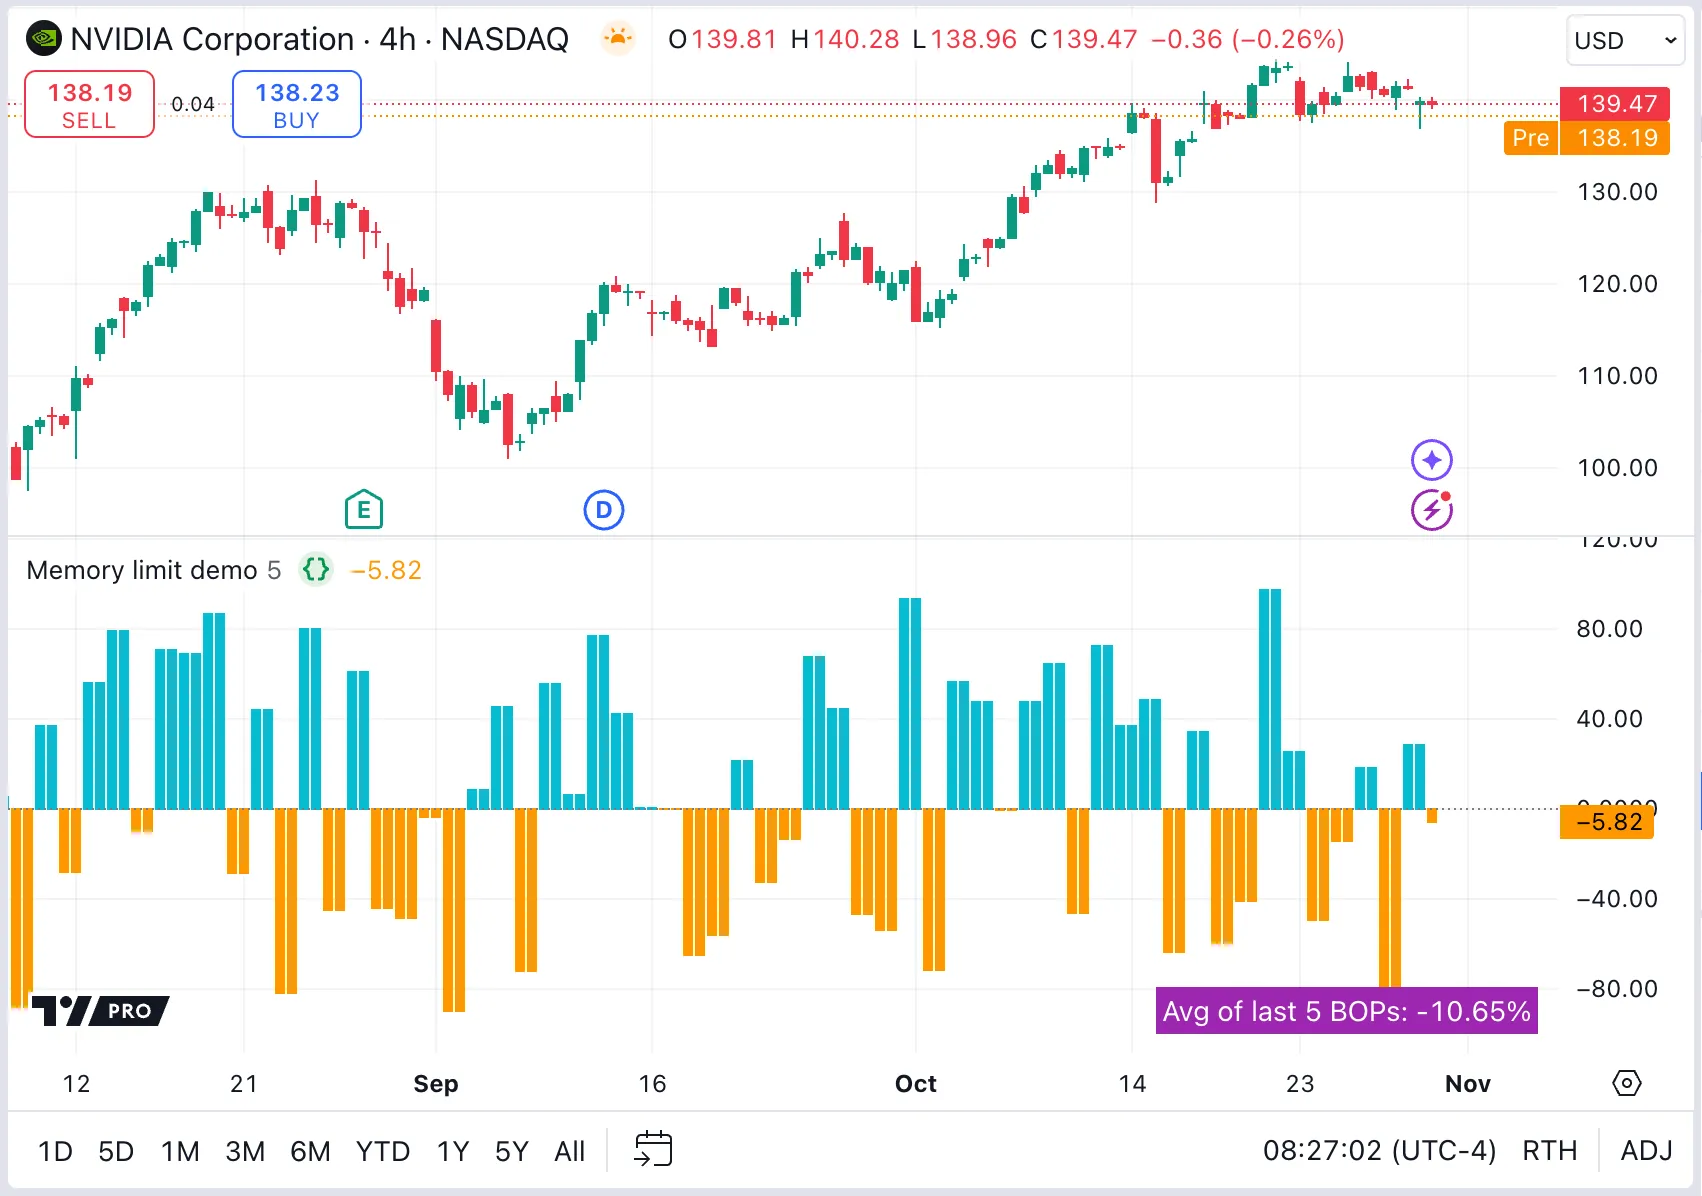
The example script below uses request.security() to retrieve the result of a user-defined function evaluated on the “1D” timeframe. The custom function (dataFunction()) creates an array and assigns its reference to a persistent variable declared using the `var` keyword, then pushes a new balance of power (BOP) value into the array and returns the collection’s reference on each bar. Each time that request.security() evaluates the dataFunction() call on the “1D” timeframe, the result references a new copy of that array. Retrieving a new array from a requested context on each bar consumes a lot of memory. Therefore, this script can exceed the memory limits when running on symbols with a sufficiently lengthy history:
How do I fix this?
Optimize requests and limit the data returned to the main context to ensure that only the minimum necessary data is stored in memory.
If possible, try to return calculated results directly rather than returning the collections themselves, or only return collections conditionally, when they are necessary in the main context.
Let’s consider a few common scenarios where scripts need specific data in the main context.
Return last state only
If a script requires only the latest state of a requested collection, use a conditional structure or expression with barstate.islast as the condition to limit retrieving a copy of that collection to the last available bar.
Here, we modified our script to display only the latest average BOP (a single value), rather than plotting an average line. The updated request function now returns the calculated BOP values directly for each bar, and returns the higher timeframe’s array only on the last bar:
Return calculated results
If a script needs the result of a calculation on a collection, but does not need the collection itself in the main context, use a user-defined function as the request expression. The function can calculate on the collection in the requested context and return only the result to the main context.
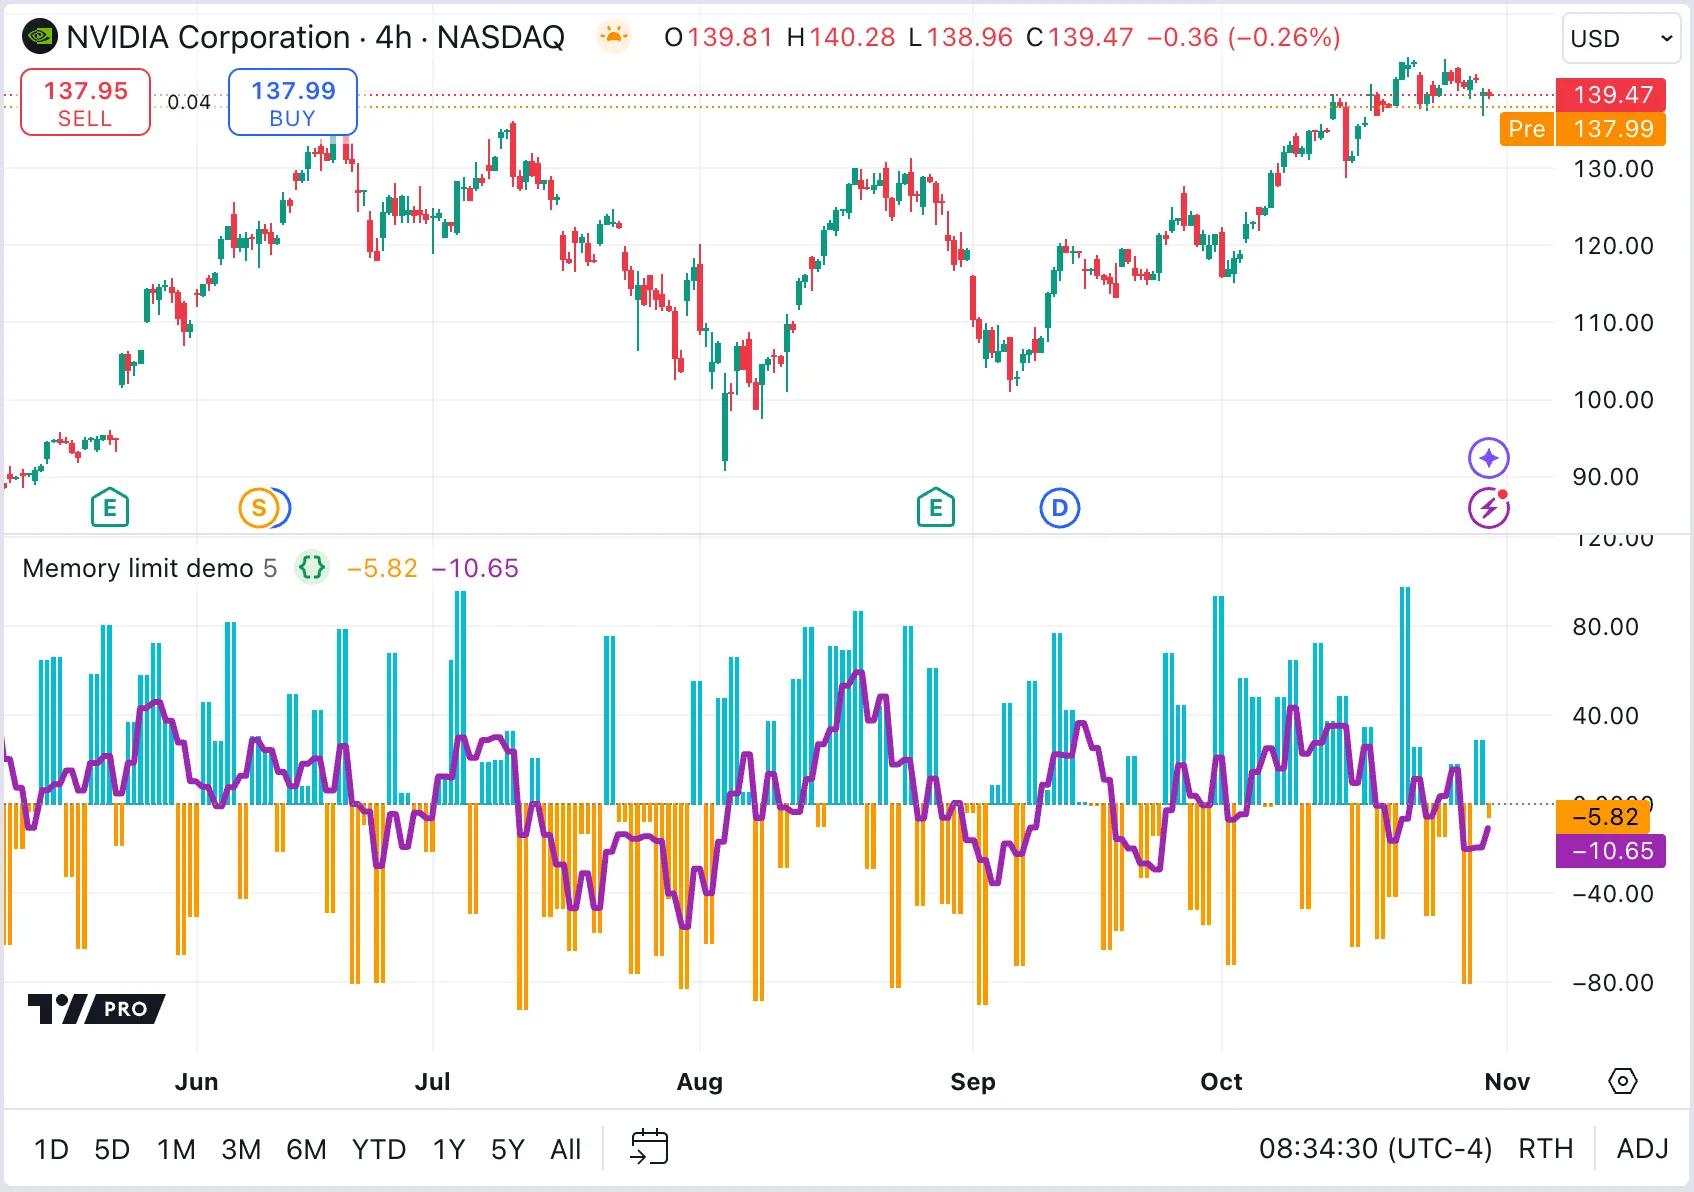
For example, we can calculate the average BOP directly within our request function. Therefore, only the calculated values are stored in memory, and the request expression returns a tuple (current BOP and average BOP) to plot the results in the main context:
Return the collection on some bars
If a script needs to retrieve a collection in the main context, but not on every bar, use conditional structures or expressions that return collection references only the necessary bars, and na on other bars. The logic in the main context can then handle the na gaps in the series and perform necessary actions on the reduced collections.
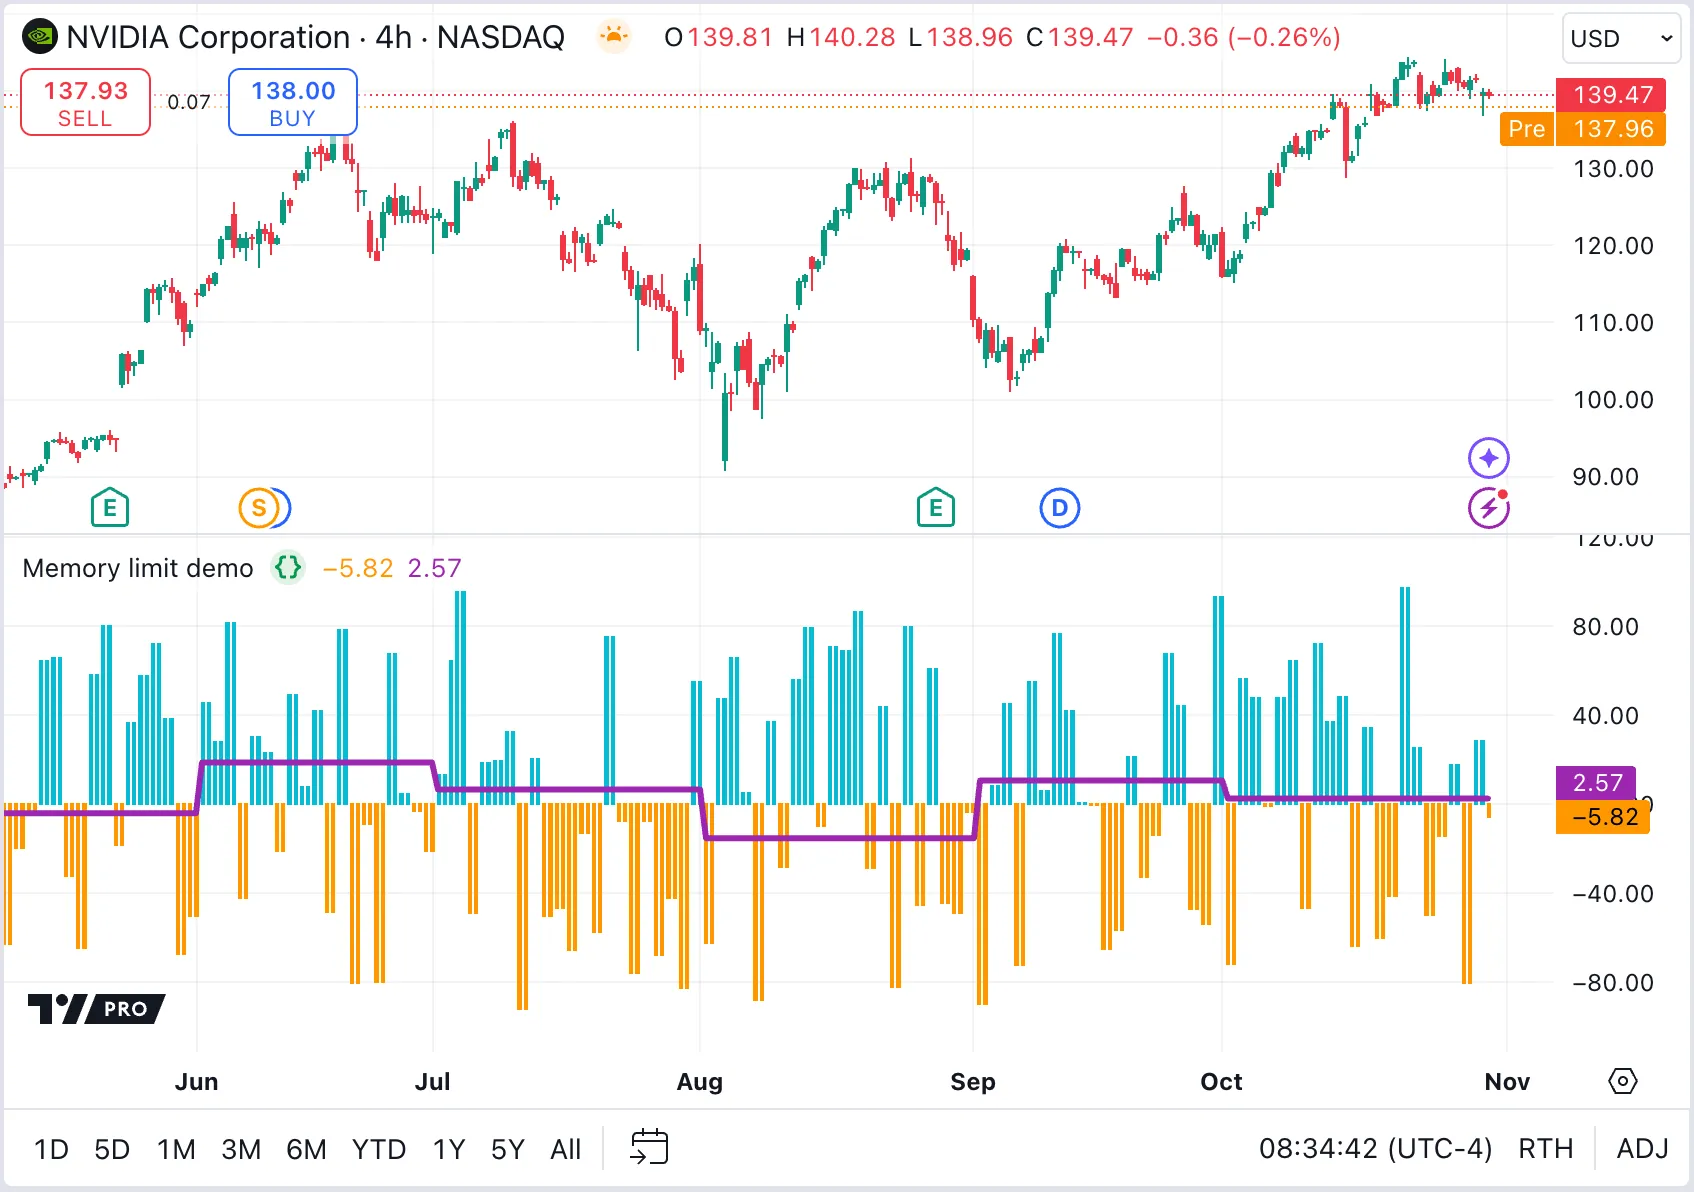
For example, if we want to calculate the average BOP for each month instead of using a user-input length, we can return the array reference from the requested context only when there is a change to a new month; na otherwise. We can then maintain the previous month’s values in the main context to keep a valid array for all intra-month bars:
Other possible error sources and their fixes
There are a few other ways to optimize scripts to consume less memory.
Minimize request.*() calls
The request.*() functions can be computationally expensive to call, because they retrieve data from additional datasets. Data requests often require significant usage of runtime and memory resources. Excessive or inefficient requests can easily cause scripts to reach the memory limit.
This memory consumption is especially substantial for scripts requesting data from lower timeframes, because the request.security_lower_tf() function returns arrays of intrabar data for each bar in the script’s main dataset. For example, requesting data from the “1” (one-minute) timeframe on a “1D” chart returns hundreds of minute bars for each “1D” bar where the request executes. In the process, the script must allocate memory to store each requested array so that it can access them later in the main context. Maintaining that much data in memory requires a significant amount of resources.
Programmers can reduce the memory requirements of a script’s requests by:
- Removing unnecessary
request.*()function calls. - Changing the timeframe of a request to a higher timeframe, effectively reducing the number of retrieved data points.
- Condensing multiple requests to the same context into a single
request.*()call. - Using the
request.*()function’scalc_bars_countparameter to restrict the historical bars in the requested dataset.
See the Minimizing `request.*()` calls section of the Profiling and optimization page to learn more about optimizing data requests.
Use max_bars_back only when necessary
The max_bars_back parameter of an indicator or strategy sets the size of the historical buffers for all series in a script. Each buffer defines the number of historical data points maintained in memory for the script’s variables and expressions.
By default, the Pine Script runtime system automatically allocates an appropriate buffer for each variable and expression. Therefore, using the max_bars_back parameter or max_bars_back() function is necessary only when Pine cannot determine the referencing length of a series.
If you encounter the referencing length error and must manually set the size of a historical buffer using the max_bars_back parameter or the max_bars_back() function, ensure that you select the minimum size that accommodates your script’s historical references. Historical buffers that contain more data points than a script requires use excessive memory resources. Read up on how to optimize using max_bars_back in this Help Center article.
Minimize historical buffer calculations
The Pine Script runtime system automatically creates historical buffers for all variables and expressions in a script. It determines the size of each buffer based on the historical references that the script performs via the [] history-referencing operator or the functions that reference history internally.
As a script loads on a dataset, historical references to distant points in the dataset can cause the system to reload the script and increase the size of necessary historical buffers. Each increase to historical buffer sizes leads to increased memory consumption. In some cases, buffer resizing can cause the script to exceed the memory limits. Therefore, ensure a script references only necessary historical data in its calculations. When possible, modify the script’s logic to avoid referencing very distant points in history.
Specifying a calc_bars_count argument in the indicator() or strategy() declaration statement can help reduce memory issues, because it restricts the number of historical bars that the script can use for its calculations. Similarly, using max_bars_back() to manually define the appropriate size for a buffer can help reduce buffer calculations. When using this function to specify the size of historical buffers, choose the smallest possible size that accommodates the script’s historical references to avoid unnecessary memory use.
To learn more about historical buffer calculations and how to optimize them, see the Minimizing historical buffer calculations section of the Profiling and optimization page.
Reduce drawing updates for tables
Tables only display their last state on a chart. Any updates to a table on historical bars are redundant, because they are not visible. To use the least memory, draw the table once, and fill it on the last bar.
To create a table object only once, assign the result of the table.new() call to a variable declared with the var keyword. When using table.cell() or the available setter functions to modify the table’s contents, execute those function calls only on the last available bar — where the table’s latest state is visible — by placing the calls in a conditional structure that uses barstate.islast as the condition. See the Tables page to learn more.
Do not update drawings on historical bars
Similar to tables, any updates to other drawing objects such as lines and labels on historical bars are never visible to the user. The user sees only the drawing updates executed on realtime bars.
Eliminate updates to historical drawings during executions on historical bars wherever possible. Refer to the Reducing drawing updates section of the Profiling and optimization page for more information.
Minimize total drawings stored for a chart
Drawing objects such as lines and labels can consume a lot of memory, especially if a script recreates drawings unnecessarily.
For example, if a script draws a line from point x1 to x2, then needs to update the line’s endpoint (x2), it’s more computationally expensive to delete the existing line and redraw a new line from x1 to x3. Instead, using the setter function line.set_x2() to update the existing line’s endpoint is more efficient.
Look for ways to optimize drawing objects in a script:
-
Reduce unnecessary redrawing by assigning a single drawing object’s reference to a variable declared with the var keyword, then modifying that object’s properties with the available setter functions.
-
Remove unnecessary chart drawings with the
*.delete()functions (e.g., line.delete() and label.delete()). -
Reduce a script’s drawing limits by specifying values for the
max_lines_count,max_labels_count,max_boxes_count, ormax_polylines_countparameters of the indicator() or strategy() declaration statement.
Filter dates in strategies
The total number of trades or orders simulated by strategies can impact memory consumption. When running strategy scripts that generate frequent orders on large datasets, reduce the number of unnecessary historical orders stored in memory by limiting the starting point of your strategy.
To limit the starting point of a strategy, a simple and effective approach is to use a conditional structure that activates the strategy’s order placement commands only when the bar’s opening or closing time comes after a specified date.
See the How do I filter trades by a date or time range? portion of our Strategies FAQ page for an example of this technique.