Data structures
What data structures can I use in Pine Script®?
Pine data structures resemble those in other programming languages, with some important differences:
-
Tuple: An arbitrary—and temporary—grouping of values of one or more types.
-
Array: An ordered sequence of values of a single type.
-
Matrix: A two-dimensional ordered sequence of values of a single type.
-
Object: An arbitrary—and persistent—collection of values of one or more types.
-
Map: An unordered sequence of key-value pairs, where the keys are of a single type and the values are of a single type.
The following sections describe each data structure in more detail.
Tuples
A tuple in Pine Script is a list of values that is returned by a function, method, or local block. Unlike in other languages, tuples in Pine serve no other function. Tuples do not have names and cannot be assigned to variables. Apart from the fact that the values are requested and returned together, the values have no relation to each other, in contrast to the other data structures described here.
To define a tuple, enclose a comma-separated list of values in square brackets.
Using a tuple to request several values from the same symbol and timeframe using a request.security() call is more efficient than making several calls. For instance, consider a script that contains separate request.security() calls for the open, high, low, and close prices:
Using a tuple can consolidate these calls into a single request.security() function call, reducing performance overhead:
See the Tuples section in the User Manual for more information.
Arrays
Arrays store multiple values of the same type in a single variable. Each element in an array can be efficiently accessed by its index—an integer corresponding to its position within the array.
Arrays can contain an arbitrary number of elements. Scripts can loop through arrays, testing each element in turn for certain logical conditions. There are also many built-in functions to perform different operations on arrays. This flexibility makes arrays very versatile data structures.
Arrays can be created with either the array.new<type>() or array.from() function. In this simple example, we store the last five closing prices in an array and display it in a table:
See the Arrays section in the User Manual for more information.
Matrices
A matrix is a two-dimensional array, made of rows and columns, like a spreadsheet. Matrices, like arrays, store values of the same built-in or user-defined type.
Matrices have many built-in functions available to organize and manipulate their data. Matrices are useful for modeling complex systems, solving mathematical problems, and improving algorithm performance.
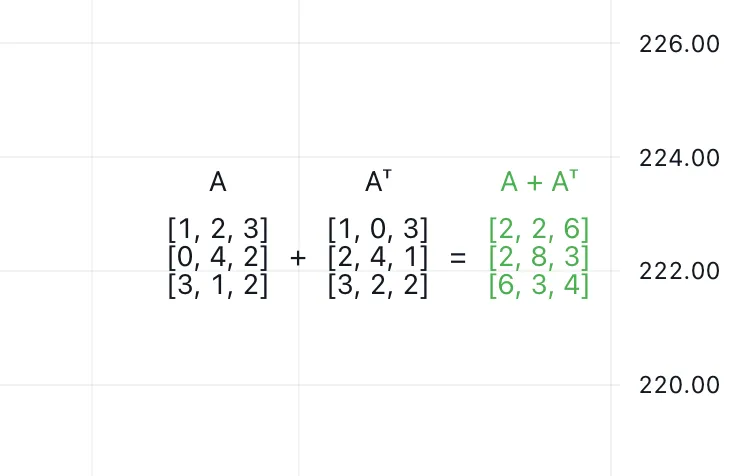
This script demonstrates a simple example of matrix addition. It creates a 3x3 matrix, calculates its transpose, then calculates the matrix.sum() of the two matrices. This example displays strings representing the original matrix, its transpose, and the resulting sum matrix in a table on the chart:
See the Matrices section in the User Manual for more information.
Objects
Pine Script objects are containers that group together multiple fields into one logical unit.
Objects are instances of user-defined types (UDTs). UDTs are similar to structs in traditional programming languages. They define the rules for what an object can contain. Scripts first create a UDT by using the type keyword and then create one or more objects of that type by using the UDT’s built-in new() method.
UDTs are composite types; they contain an arbitrary number of fields that can be of any type. A UDT’s field type can even be another UDT, which means that objects can contain other objects.
Our example script creates a new pivot object each time a new pivot is found, and draws a label using each of the object’s fields:
See the User Manual page on Objects to learn more about working with UDTs.
Maps
Maps in Pine Script are similar to dictionaries in other programming languages, such as dictionaries in Python, objects in JavaScript, or HashMaps in Java. Maps store elements as key-value pairs, where each key is unique. Scripts can access a particular value by looking up its associated key.
Maps are useful because they can access data directly without searching through each element, unlike arrays. For example, maps can be more performant and simpler than arrays for associating specific attributes with symbols, or dates with events.
The following example illustrates the practical application of maps for managing earnings dates and values as key-value pairs, with dates serving as the keys:
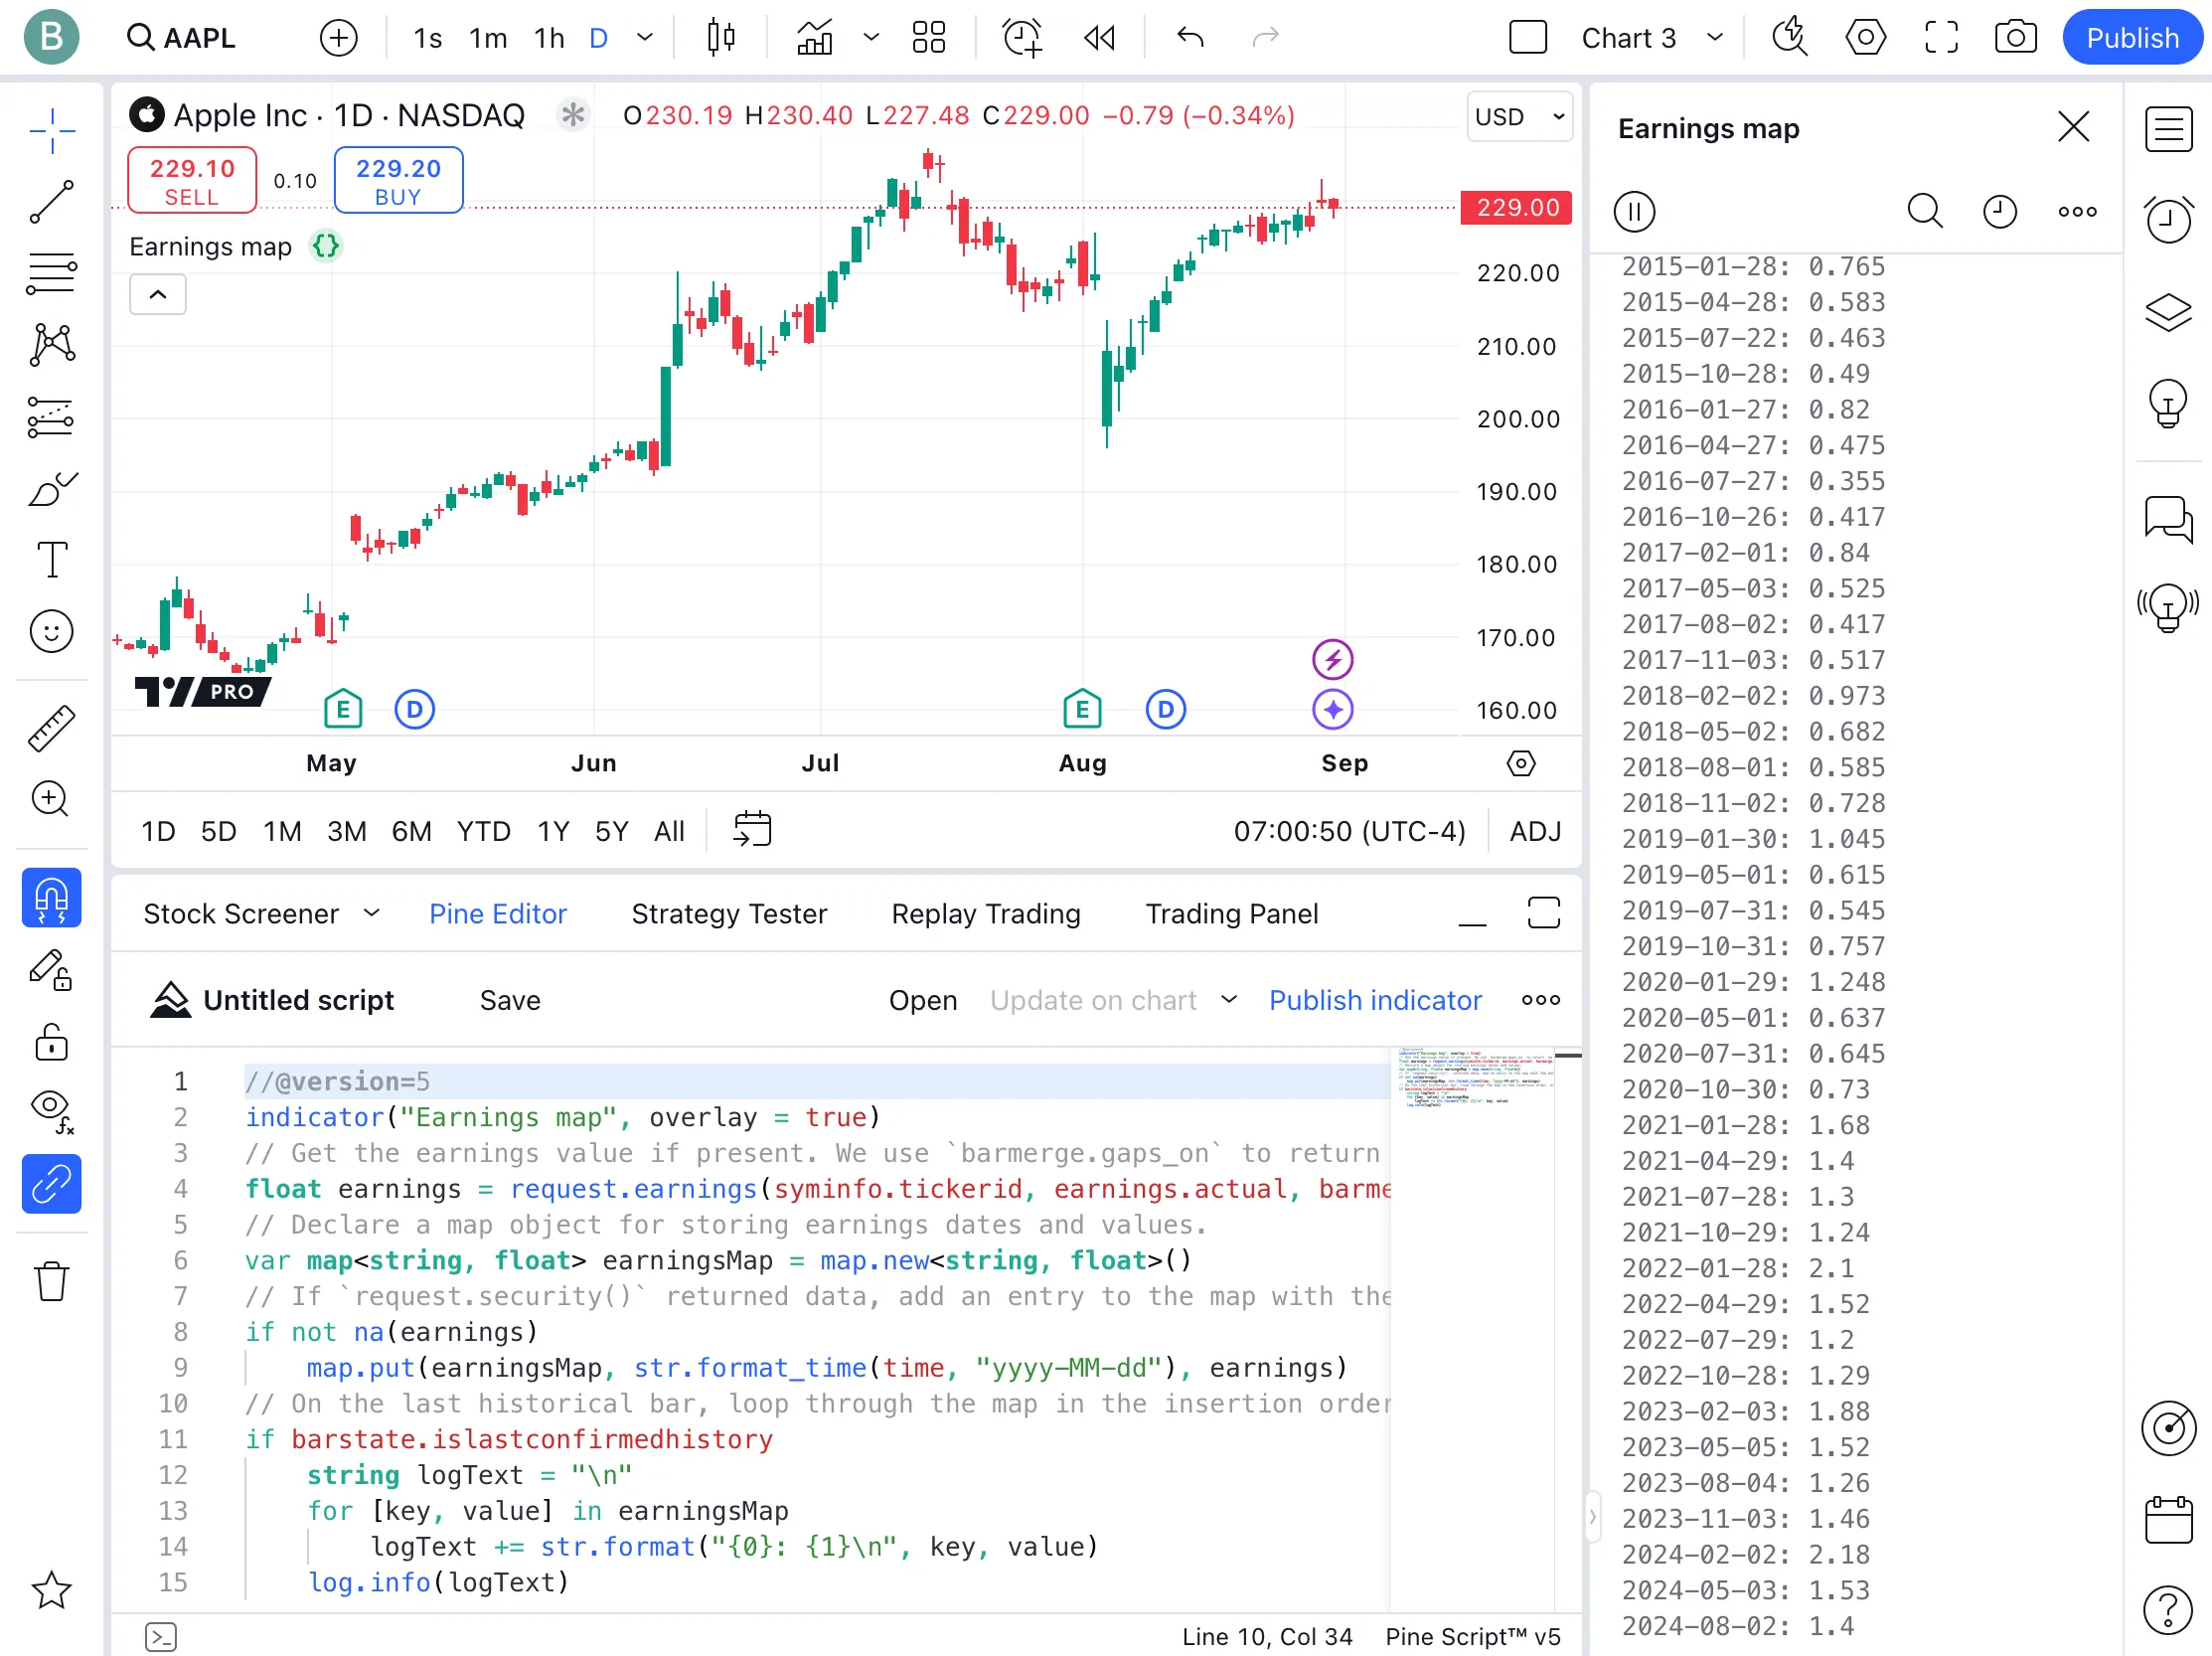
Here, we use request.earnings() with the barmerge parameter set to barmerge.gaps_on to return the earnings value on bars where earnings data is available, and return na otherwise. We add non-na values to the map, associating the dates that earnings occurred with the earnings numbers. Finally, on the last historical bar, the script loops through the map, logging each key-value pair to display the map’s contents.
To learn more about working with maps, refer to the Maps section in the User Manual.
What’s the difference between a series and an array?
In Pine Script, “series” variables are calculated on each bar. Historical values cannot change. Series values can change during the open realtime bar, but when the bar closes, the value for that bar becomes fixed and immutable. These fixed values are automatically indexed for each bar. Scripts can access values from previous bars by using the [] history-referencing operator to go back one or more bars.
Where “series” variables are strictly time-indexed, and the historical values are created automatically, arrays are created, filled, and manipulated arbitrarily by a script’s logic. Programmers can change the size of arrays dynamically by using functions that insert or remove elements. Any element in an array can also be altered using the array.set() function.
The concept of time series is a fundamental aspect of Pine Script. Its series-based execution model processes scripts bar-by-bar. This built-in behavior mimics looping, allowing a series to track values, accumulate totals, or perform calculations across a sequence of data on each bar.
Simple calculations can thus be done efficiently using “series” variables. Using arrays for similar tasks requires manually creating a dataset, managing its size, and using loops to process the array’s contents, which can be far less efficient.
Arrays, of course, can do many things that series variables cannot. Scripts can use arrays to store a fixed set of values, collect complex data such as objects of user-defined types, manage drawing instances for visual display, and more. In general, use arrays to handle data that doesn’t fit the time series model, or for complex calculations. Arrays can also mimic series by creating custom datasets, as in the getSeries library.
How do I create and use arrays in Pine Script?
Pine Script arrays are one-dimensional collections that can hold multiple values of a single type.
Declaring arrays
Declare an array by using one of the following functions: array.new<type>(), array.from(), or array.copy(). Arrays can be declared with the var keyword to have their values persist from bar to bar, or without it, so that the values initialize again on each bar. For more on the differences between declaring arrays with or without var, see this section of this FAQ.
Adding and removing elements
Pine Script provides several functions for dynamically adjusting the size and contents of arrays.
- array.unshift() inserts a new element at the beginning of an array (index 0) and increases the index values of any existing elements by one.
- array.insert() inserts a new element at the specified index and increases the index of existing elements at or after the insertion index by one. It accepts both positive and negative indices, which reference an element’s position starting from the beginning of the array or from the end, respectively.
- array.push() adds a new element at the end of an array.
- array.remove() removes the element at the specified index and returns that element’s value. It accepts both positive and negative indices, which reference an element’s position starting from the beginning of the array or from the end, respectively.
- array.shift() removes the first element from an array and returns its value.
- array.pop() removes the last element of an array and returns its value.
- array.clear() removes all elements from an array. Note that clearing an array won’t delete any objects that were referenced by its elements. To delete objects contained by an array, loop through the array and delete the objects first, and then clear the array.
The flexibility afforded by these functions supports various data management strategies, such as queues or stacks, which are useful for custom datasets or sliding window calculations. Read more about implementing a stack or queue in this FAQ entry.
Calculations on arrays
Because arrays are not time series data structures, performing operations across an array’s elements requires special functions designed for arrays. Programmers can write custom functions to perform calculations on arrays. Additionally, built-in functions enable computations like finding the maximum, minimum, or average values within an array. See the Calculation on arrays section of the User Manual for more information.
Script example
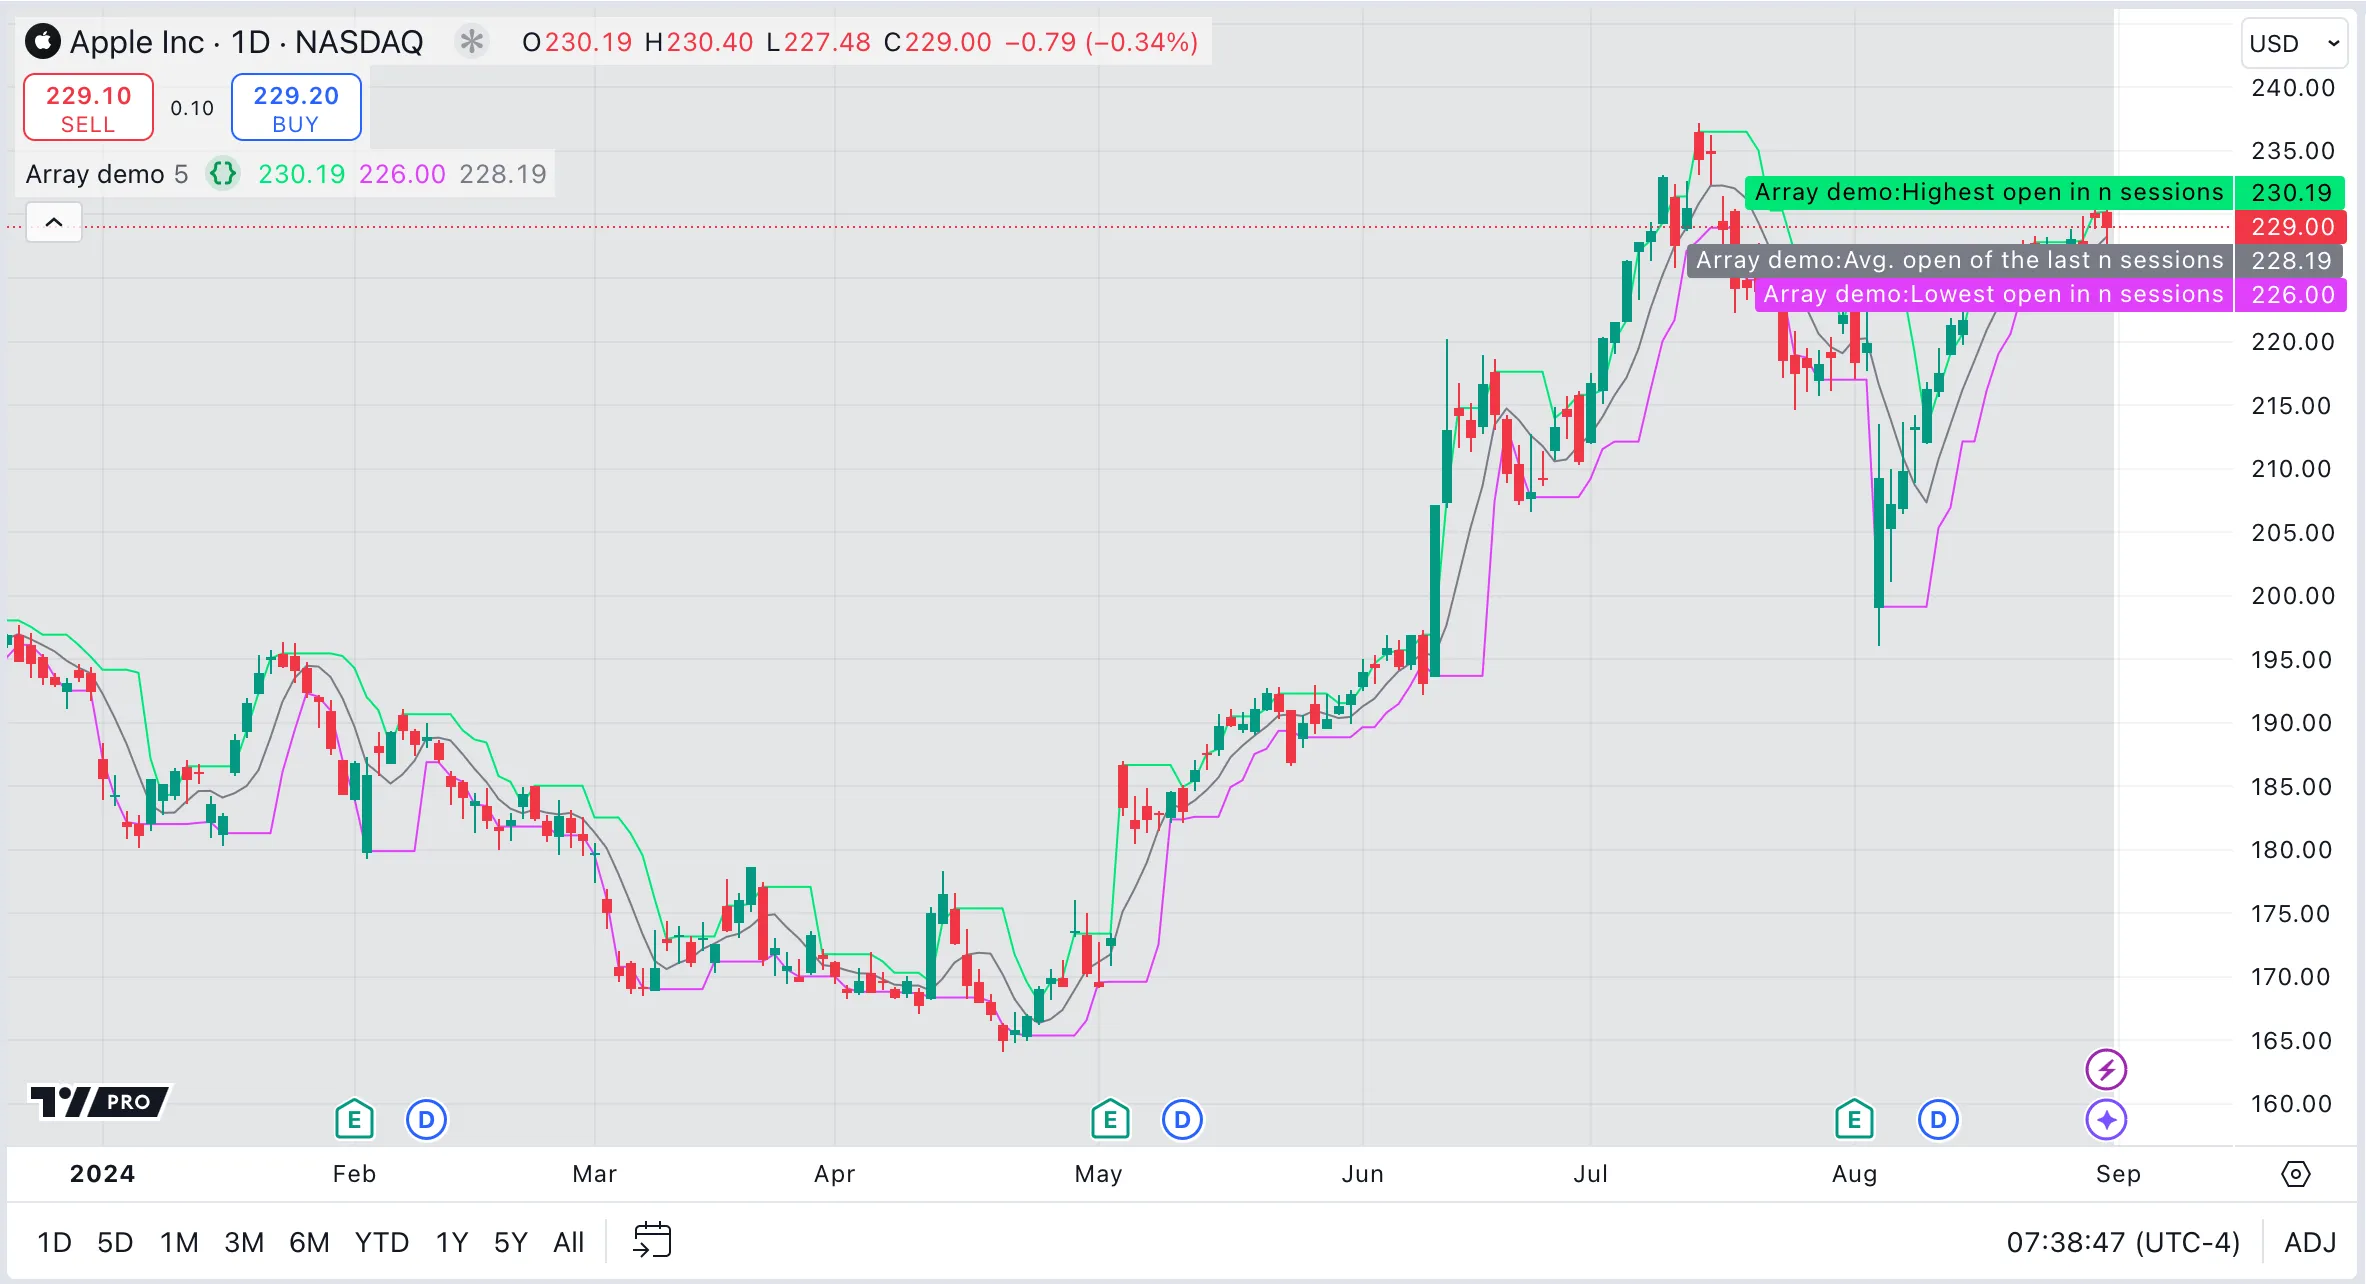
This script example demonstrates a practical application of arrays by tracking the opening prices of the last five sessions. The script declares a float array to hold the prices using the var keyword, allowing it to retain its values from bar to bar.
At the start of each session, we update the array by adding the new opening price and removing the oldest one. This process, resembling a queue, keeps the array’s size constant while maintaining a moving window of the session opens for the last five days. Built-in array functions return the highest, lowest, and average opening price over the last five sessions. We plot these values to the chart.
For more information about arrays, see the Arrays page in the User Manual.
What’s the difference between an array declared with or without var?
Using the var keyword, a script can declare an array variable in a script that is initialized only once, during the first iteration on the first chart bar.
Persistent arrays
When an array is declared with var, it is initialized only once, at the first execution of the script. This allows the array to retain its contents and potentially grow in size across bars, making it ideal for cumulative data collection or tracking values over time.
Non-persistent arrays
Arrays declared without var are reinitialized on every new bar, effectively resetting their content. This behavior suits scenarios where calculations are specific to the current bar, and historical data retention is unnecessary.
Example script
Here, we initialize two arrays. Array a is declared without using the var keyword, while array b
is declared with var, allowing us to observe and compare their behavior. Throughout the runtime, we incrementally add an element to
each array on each bar. We use a table to present and compare both the sizes of these arrays and the number of chart bars, effectively illustrating the impact of
different declaration methods on array behavior:
Results
- Array A (Non-Persistent): This array is reset at the beginning of each new bar. As a result, despite adding elements on each bar, its size remains constant, reflecting only the most recent addition.
- Array B (Persistent): This array retains its elements and accumulates new entries across bars, mirroring the growing count of chart bars. This persistent nature of the array shows its ability to track or aggregate data over the script’s runtime.
For further details, consult the sections concerning variable declaration modes and their use in array declarations in the User Manual.
What are queues and stacks?
Scripts can use arrays to create queues and stacks.
Stacks
Queues
Stacks are particularly useful for accessing the most recent data, such as for tracking price levels. Queues are used for sequential data processing tasks, like event handling. Two example scripts follow, to illustrate these different usages.
Example: Arrays as stacks
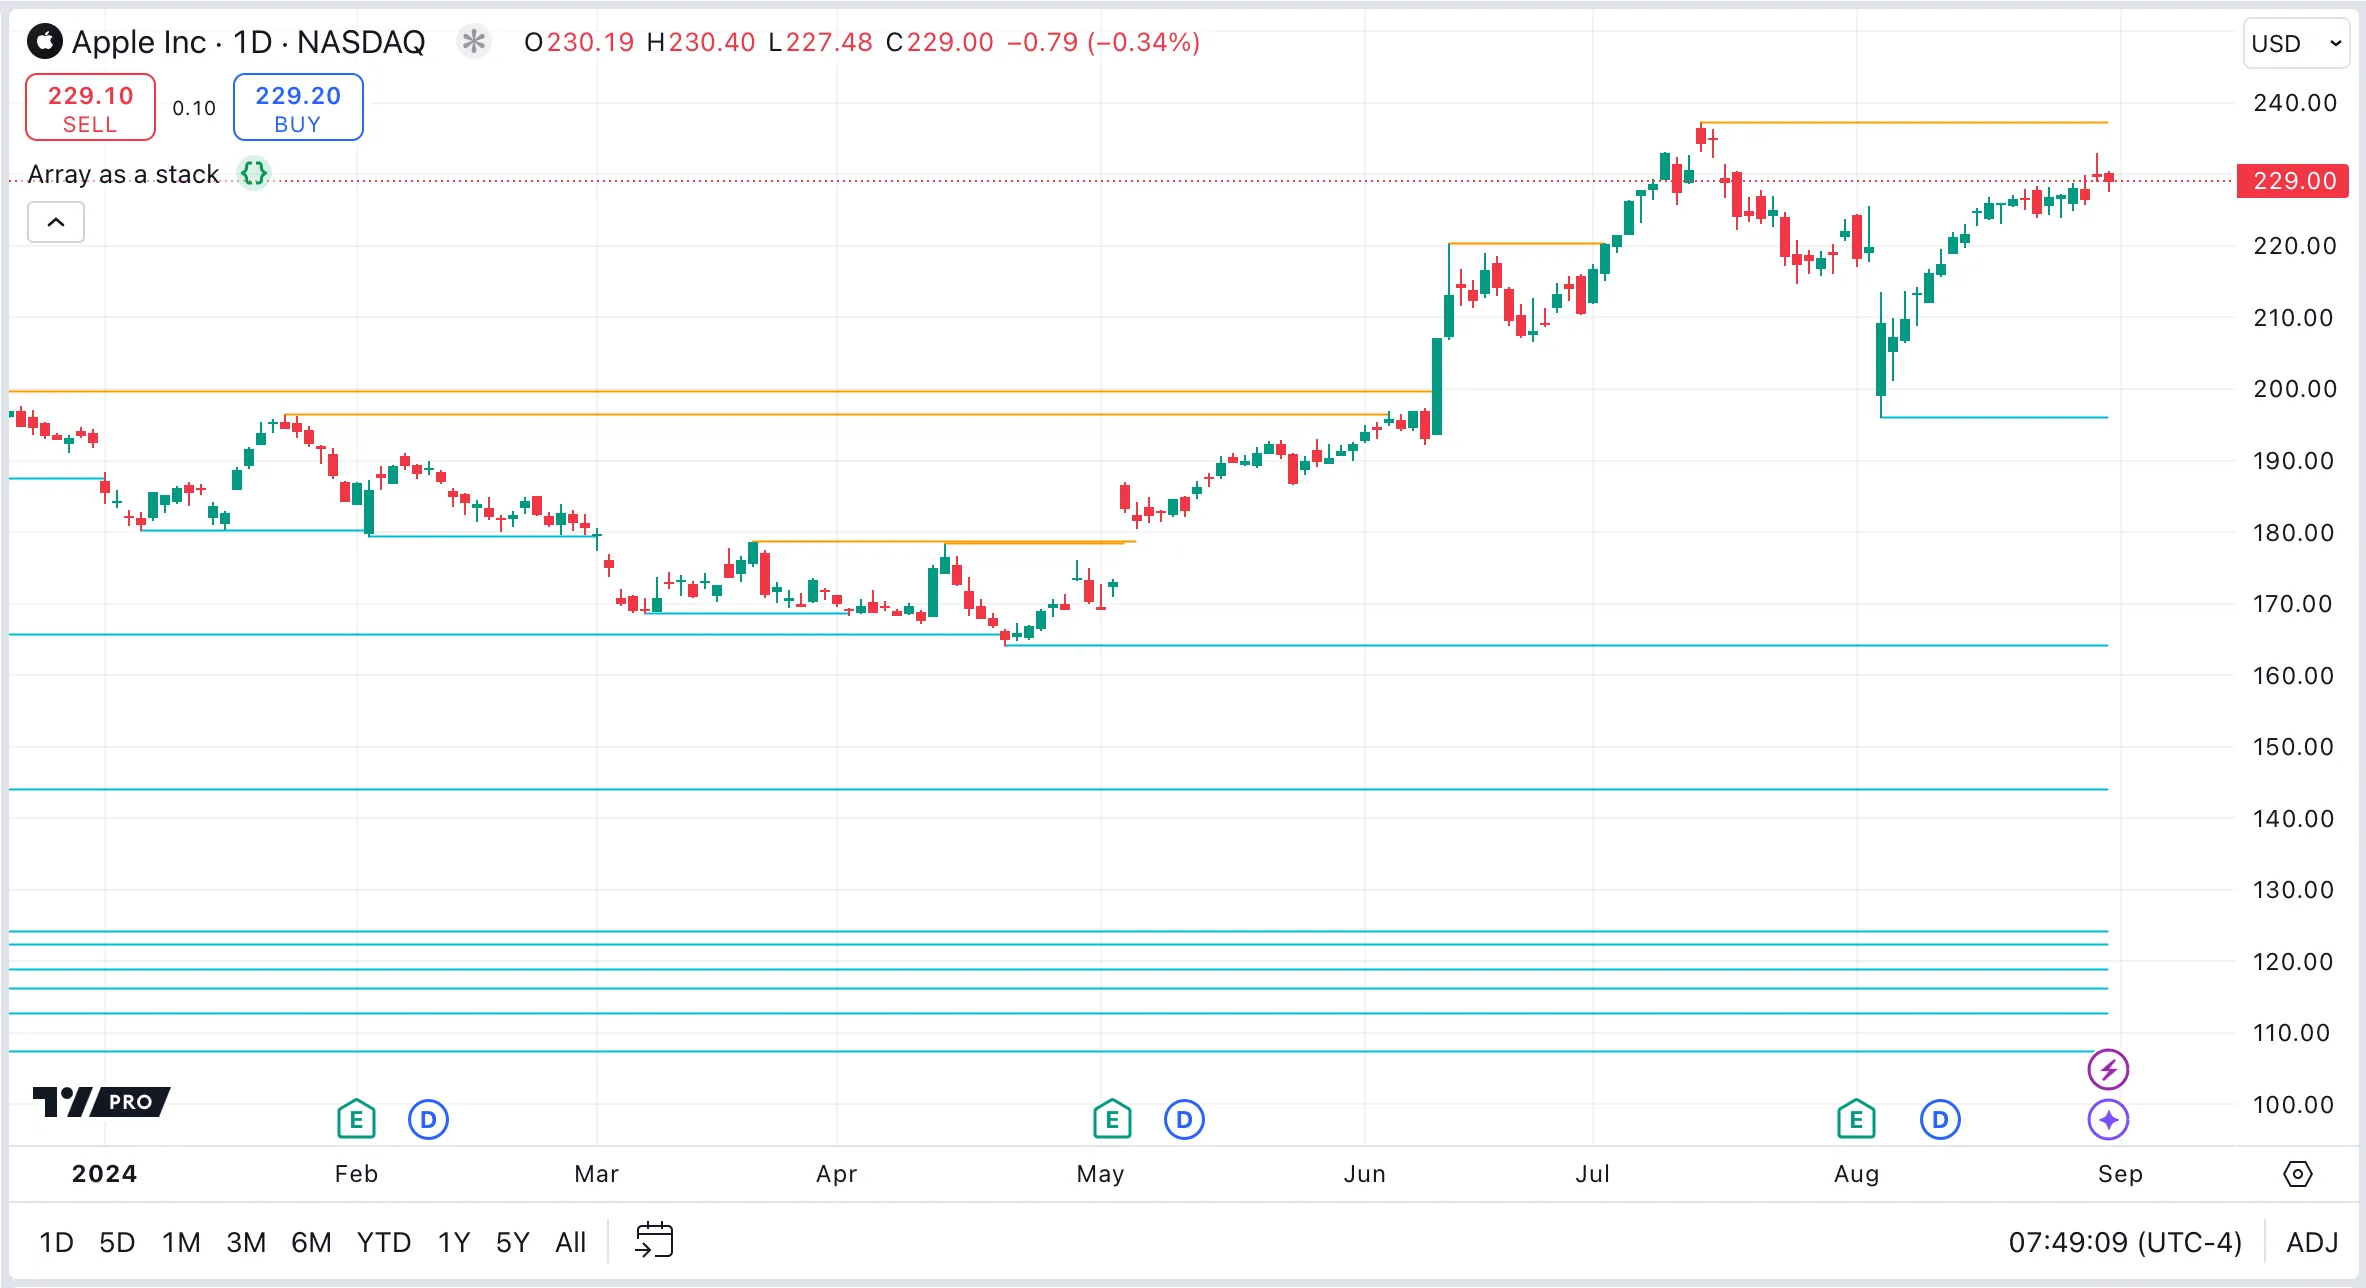
This script uses arrays as stacks to manage pivot points. It draws lines from the pivot points and extends the lines with each new bar until price intersects them. When the script detects a pivot point, it adds (pushes) a new line to the stack. With each new bar, the script extends the end point of each line in the stack. It then checks whether price has intersected the high or low pivot lines at the top of the stack. If so, the script removes (pops) the intersected line from the stack, meaning that it will no longer be extended with new bars. Note that we do not need to iterate through the arrays to check all the lines, because price is always between only the high and low pivot lines at the end of each array.
Example: Arrays as queues
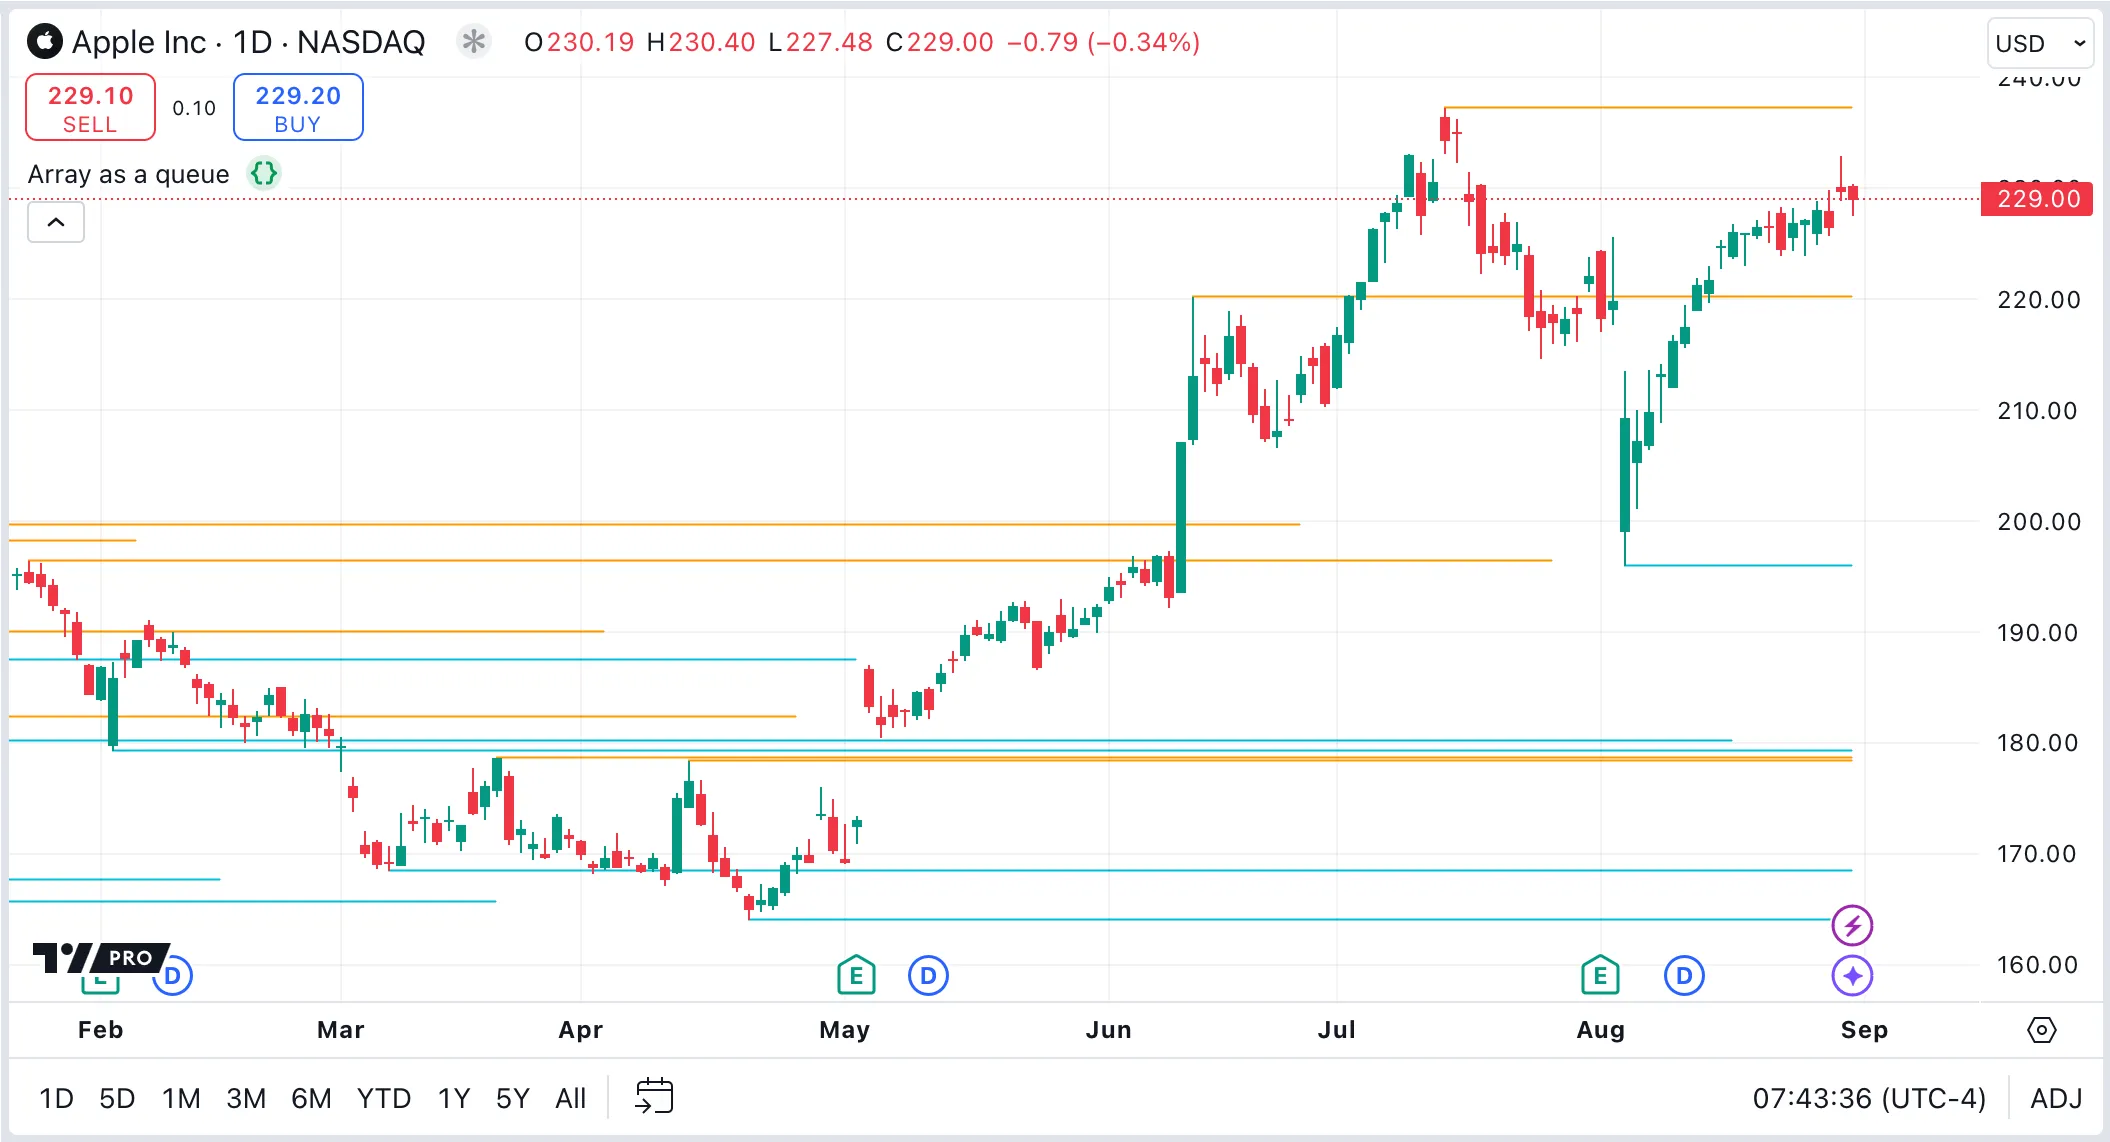
This script uses arrays as queues to track pivot points for monitoring recent support and resistance levels. It dynamically updates lines extending from the four most recent pivot highs and lows to the current bar with each new bar. When the script detects a new pivot high or low, it adds a line that represents this pivot to the respective queue. To maintain the queue’s size at a constant four items, the script removes the oldest line in the queue whenever it adds a new line.
For more information on manipulating arrays, see the Arrays section in the User Manual.
How can I perform operations on all elements in an array?
In Pine Script, there are no built-in functions to apply operations across the entire array at once. Instead, scripts need to iterate through the array, performing the operation on each element one at a time.
The easiest way to retrieve each element in an array is by using a for…in structure. This type of loop retrieves each element in turn, without the need for specifying the number of iterations.
The simple form of the loop has the format for element in array, where element is a variable that is assigned the current array element being accessed.
If the script’s logic requires the position of the element in the array, use the two-argument form: for [index, element] in array. This form returns both the current element and its index in a tuple.
Example: retrieving array elements
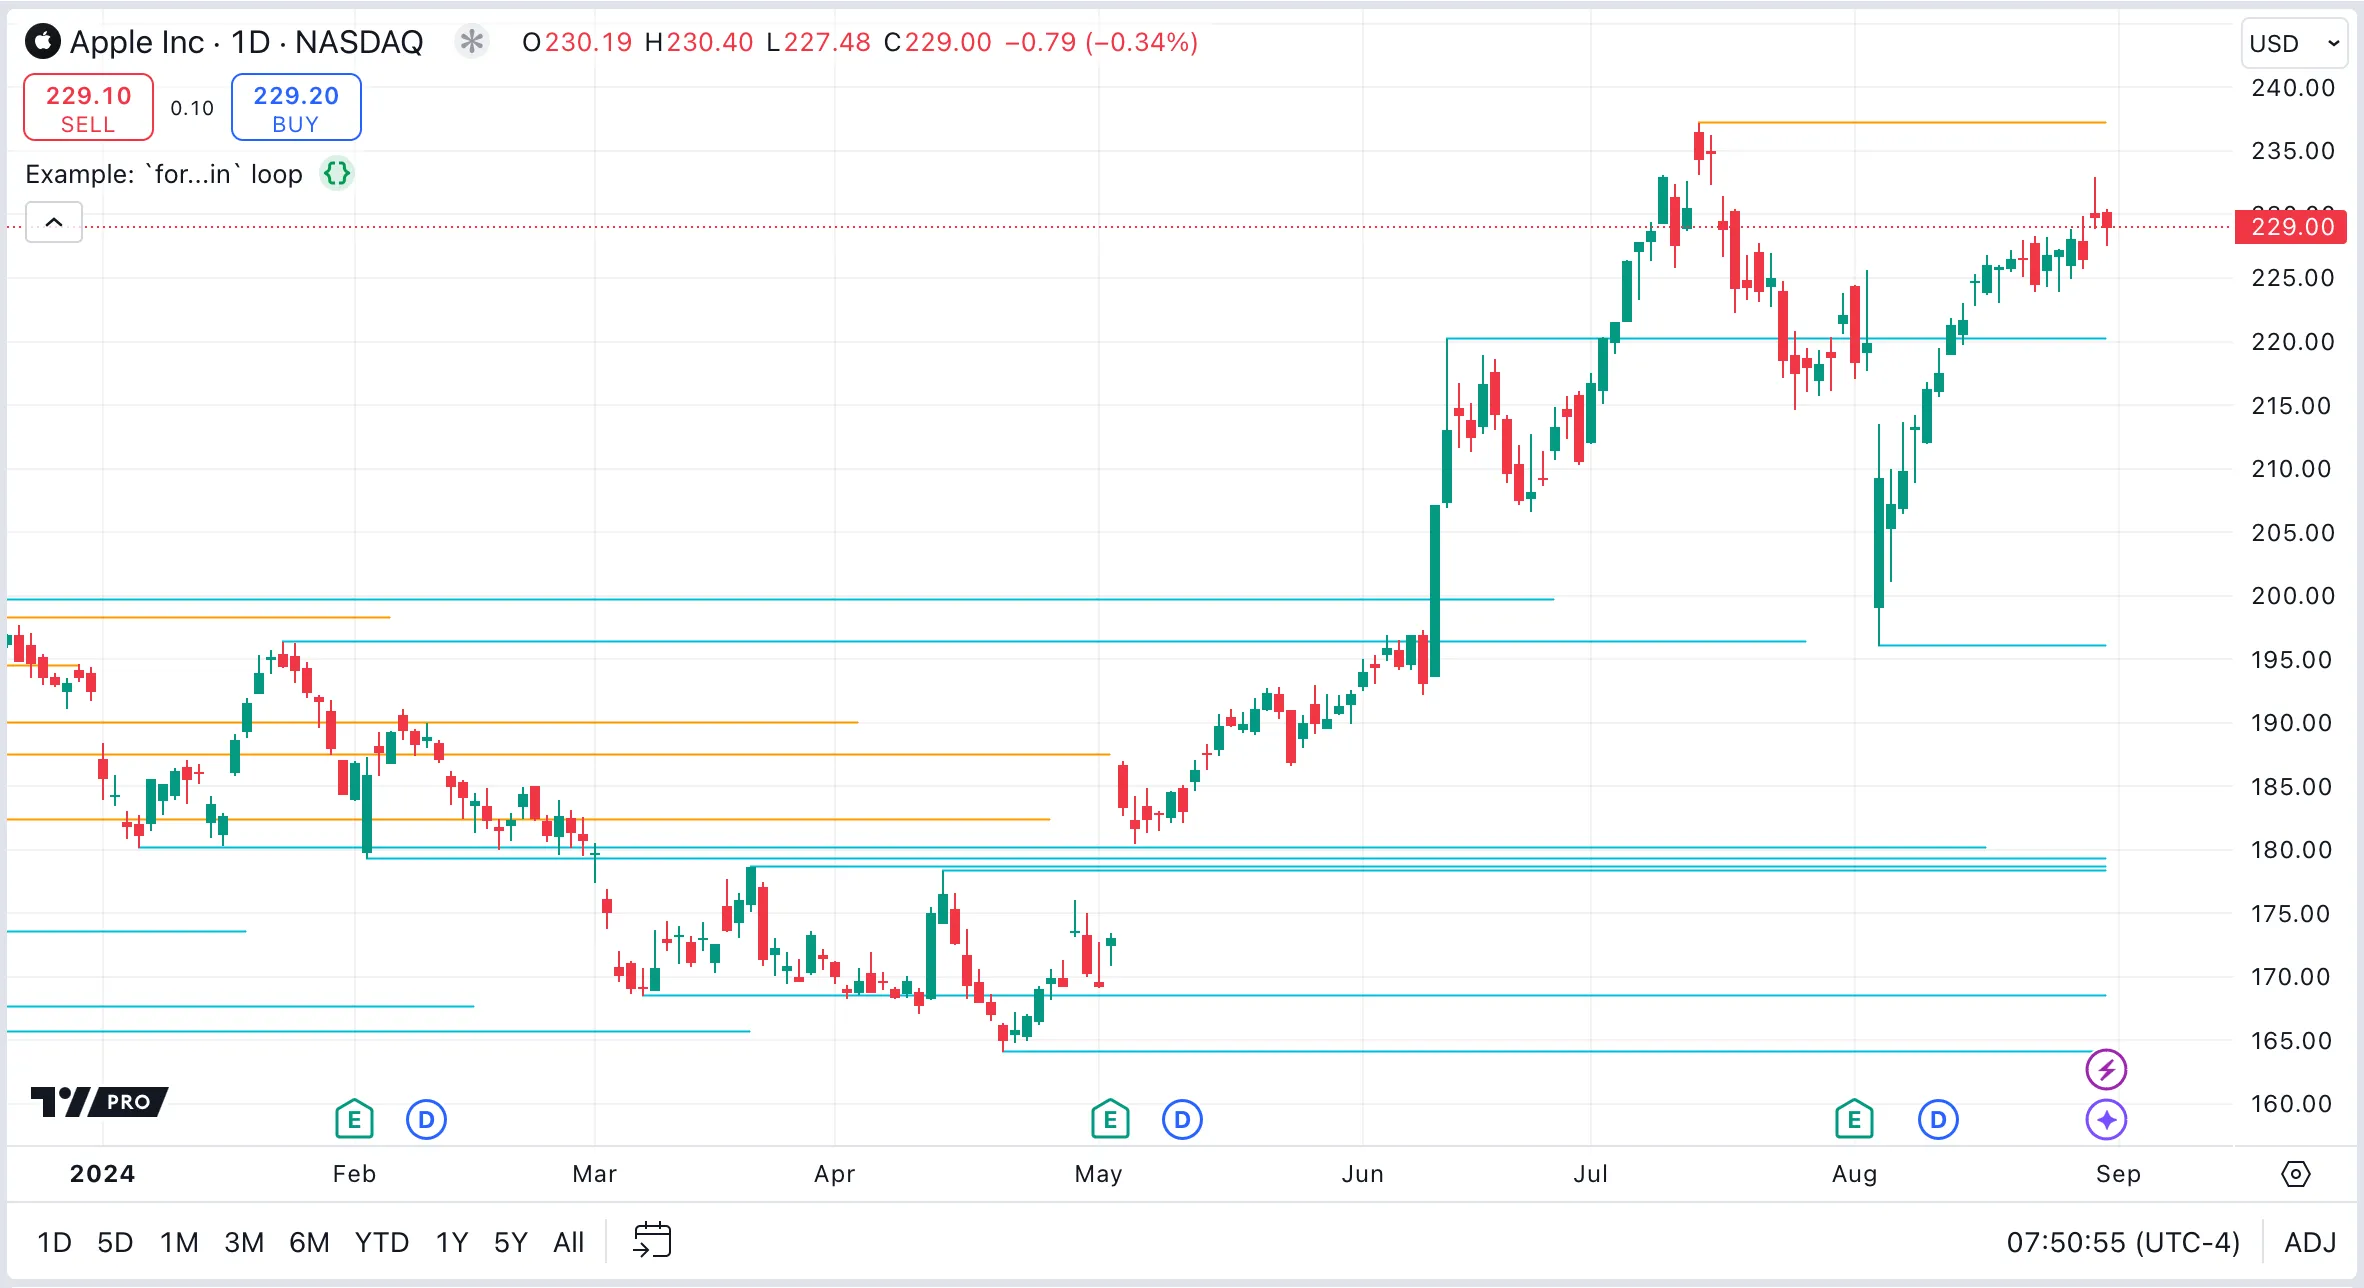
This first example script uses an array as a queue to store lines representing the latest four pivot highs and lows. The for…in loop performs two tasks:
- It adjusts the
x2endpoint of each line to the current bar_index. - It changes the colors of the lines to blue for support or orange for resistance, based on their position relative to the close price.
Note that neither of these operations requires knowing the index of the array element.
Example: retrieving array elements and indices
In our second script, we use the two-argument variant of the for…in loop to access elements and their indices in an array. This method facilitates operations that depend on element indices, such as managing parallel arrays or incorporating index values into calculations. The script pairs a boolean array with an array of positive and negative random integers. The boolean array flags whether each corresponding integer in the primary array is positive.
What’s the most efficient way to search an array?
The obvious way to search for an element in an array is to use a loop to check each element in turn. However, there are more efficient ways to search, which can be useful in different situations. Some of the following functions return only the index of a value. Programmers can then use array.get() if the script needs the actual value.
Checking if a value is present in an array
If all the script needs to do is to check whether a certain value is present in an array or not, use the array.includes() function. If the element is found, the function returns true; otherwise, it returns false. This method does not return the index of the element.
The following example script checks if the value 3 is present in the values array, and displays either “found” or “not found” in a label.
Finding the position of an element
If the script requires the position of an element, programmers can use the array.indexof() function.
This function returns the index of the first occurrence of a value within an array. If the value is not found, the function returns -1.
This method does not show whether there are multiple occurrences of the search value in the array. Depending on the script logic, this method might not be suitable if the array contains values that are not unique.
The following script searches for the first occurrence of 101.2 in the prices array and displays “found” and the value’s index in a label, or “not found” otherwise.
Binary search
If the script requires the position of the element in a sorted array, the function array.binary_search() returns the index of a value more efficiently than array.indexof(). The performance improvement is significant for large arrays. If the value is not found, the function returns -1.
This script uses a binary search to find the value 100.5 within an array of prices. The script displays the original array, the sorted array, the target value (100.5), and the result of the search.
If the value is found, it displays “found”, along with the index of the value. If the value is not found, it displays “not found”.
If a script does not need the exact value, the functions array.binary_search_leftmost() and array.binary_search_rightmost() provide an effective way to locate the nearest index to a given value in sorted arrays. These functions return the index of the value, if it is present. If the value is not present, they return the index of the element that is closest to the search value on the left (smaller) or right (larger) side.
How can I debug arrays?
To debug arrays, scripts need to display the contents of the array at certain points in the script. Techniques that can display the contents of arrays include using plots, labels, tables, and Pine Logs.
For information about commonly encountered array-related errors, refer to the array Error Handling section in the User Manual.
Plotting
Using the plot() function to inspect the contents of an array can be helpful because this function can show numerical values on the script’s status line, the price scale, and the Data Window. It is also easy to review historical values.
Limitations of this approach include:
- Arrays must be of type “float” or “int”.
- The number of plots used for debugging counts towards the plot limit for a script.
- Plot calls must be in the global scope and scripts cannot call them conditionally. Therefore, if the size of the array varies across bars, using this technique can be impractical.
Here we populate an array with the open, high, low and close (OHLC) prices on each bar. The script retrieves all the elements of the array and plots them on the chart.
Using labels
Using labels to display array values on certain bars is particularly useful for non-continuous data points or to view all elements of an array simultaneously. Scripts can create labels within any local scope, including functions and methods. Scripts can also position drawings at any available chart location, irrespective of the current bar_index. Unlike plots, labels can display the contents of a variety of array types, including boolean and string arrays.
Limitations of using labels include:
- Pine labels display only in the chart pane.
- Scripts can display only up to a maximum number of labels.
In the following example script, we monitor the close price at the last four moving average (MA) crosses in a queued array and use a label to display this array from a local scope whenever a cross occurs:
For more information, see the Labels section of the Debugging page in the User Manual.
Using label tooltips
If programmers want to be able to inspect the values in an array on every bar, displaying the contents of the array in a label is not convenient, because the labels overlap and become difficult to read. In this case, displaying the array contents in a label tooltip can be visually clearer. This method has the same advantages and limitations as using labels in the section above.
This example script plots a fast and a slow moving average (MA). It maintains one array of the most recent three values of the fast MA, and one array for the slow MA. The script prints empty labels on each bar. The tooltip shows the values of the MA arrays and whether or not the MAs crossed this bar. The labels are displayed in a semi-transparent color, and the tooltip is visible only when the cursor hovers over the label.
Using tables
Using tables for debugging offers a more organized and scalable alternative to labels. Tables can display multiple “series” strings in a clear format that remains unaffected by the chart’s scale or the index of the bars.
Limitations of using tables for debugging include that, unlike labels, the state of a table can only be viewed from the most recent script execution, making it hard to view historical data. Additionally, tables are computationally more expensive than other debugging methods and can require more code.
In the following example script, we create and display two unrelated arrays, to show how flexible this approach can be. The first array captures the times of the last six bars where a Golden Cross occurred. The second array records the last eight bar indices where the Relative Strength Index (RSI) reached new all-time highs within the chart’s history. We use the whenSince() function from the PineCoders’ getSeries library to create and update the arrays. This function treats the arrays as queues, and limits their size.
Using Pine Logs
Pine Logs are messages that display in the Pine Logs pane, along with a timestamp when the logging function was called.
Scripts can create log messages at specific points during the execution of a script. Programmers can use the log.*() functions to create Pine Logs from almost anywhere in a script — including inside the local scopes of user-defined functions, conditional structures, and loops.
By logging messages to the console whenever there is a modification to the array, programmers can track the logical flow of array operations in much more detail than by using other approaches.
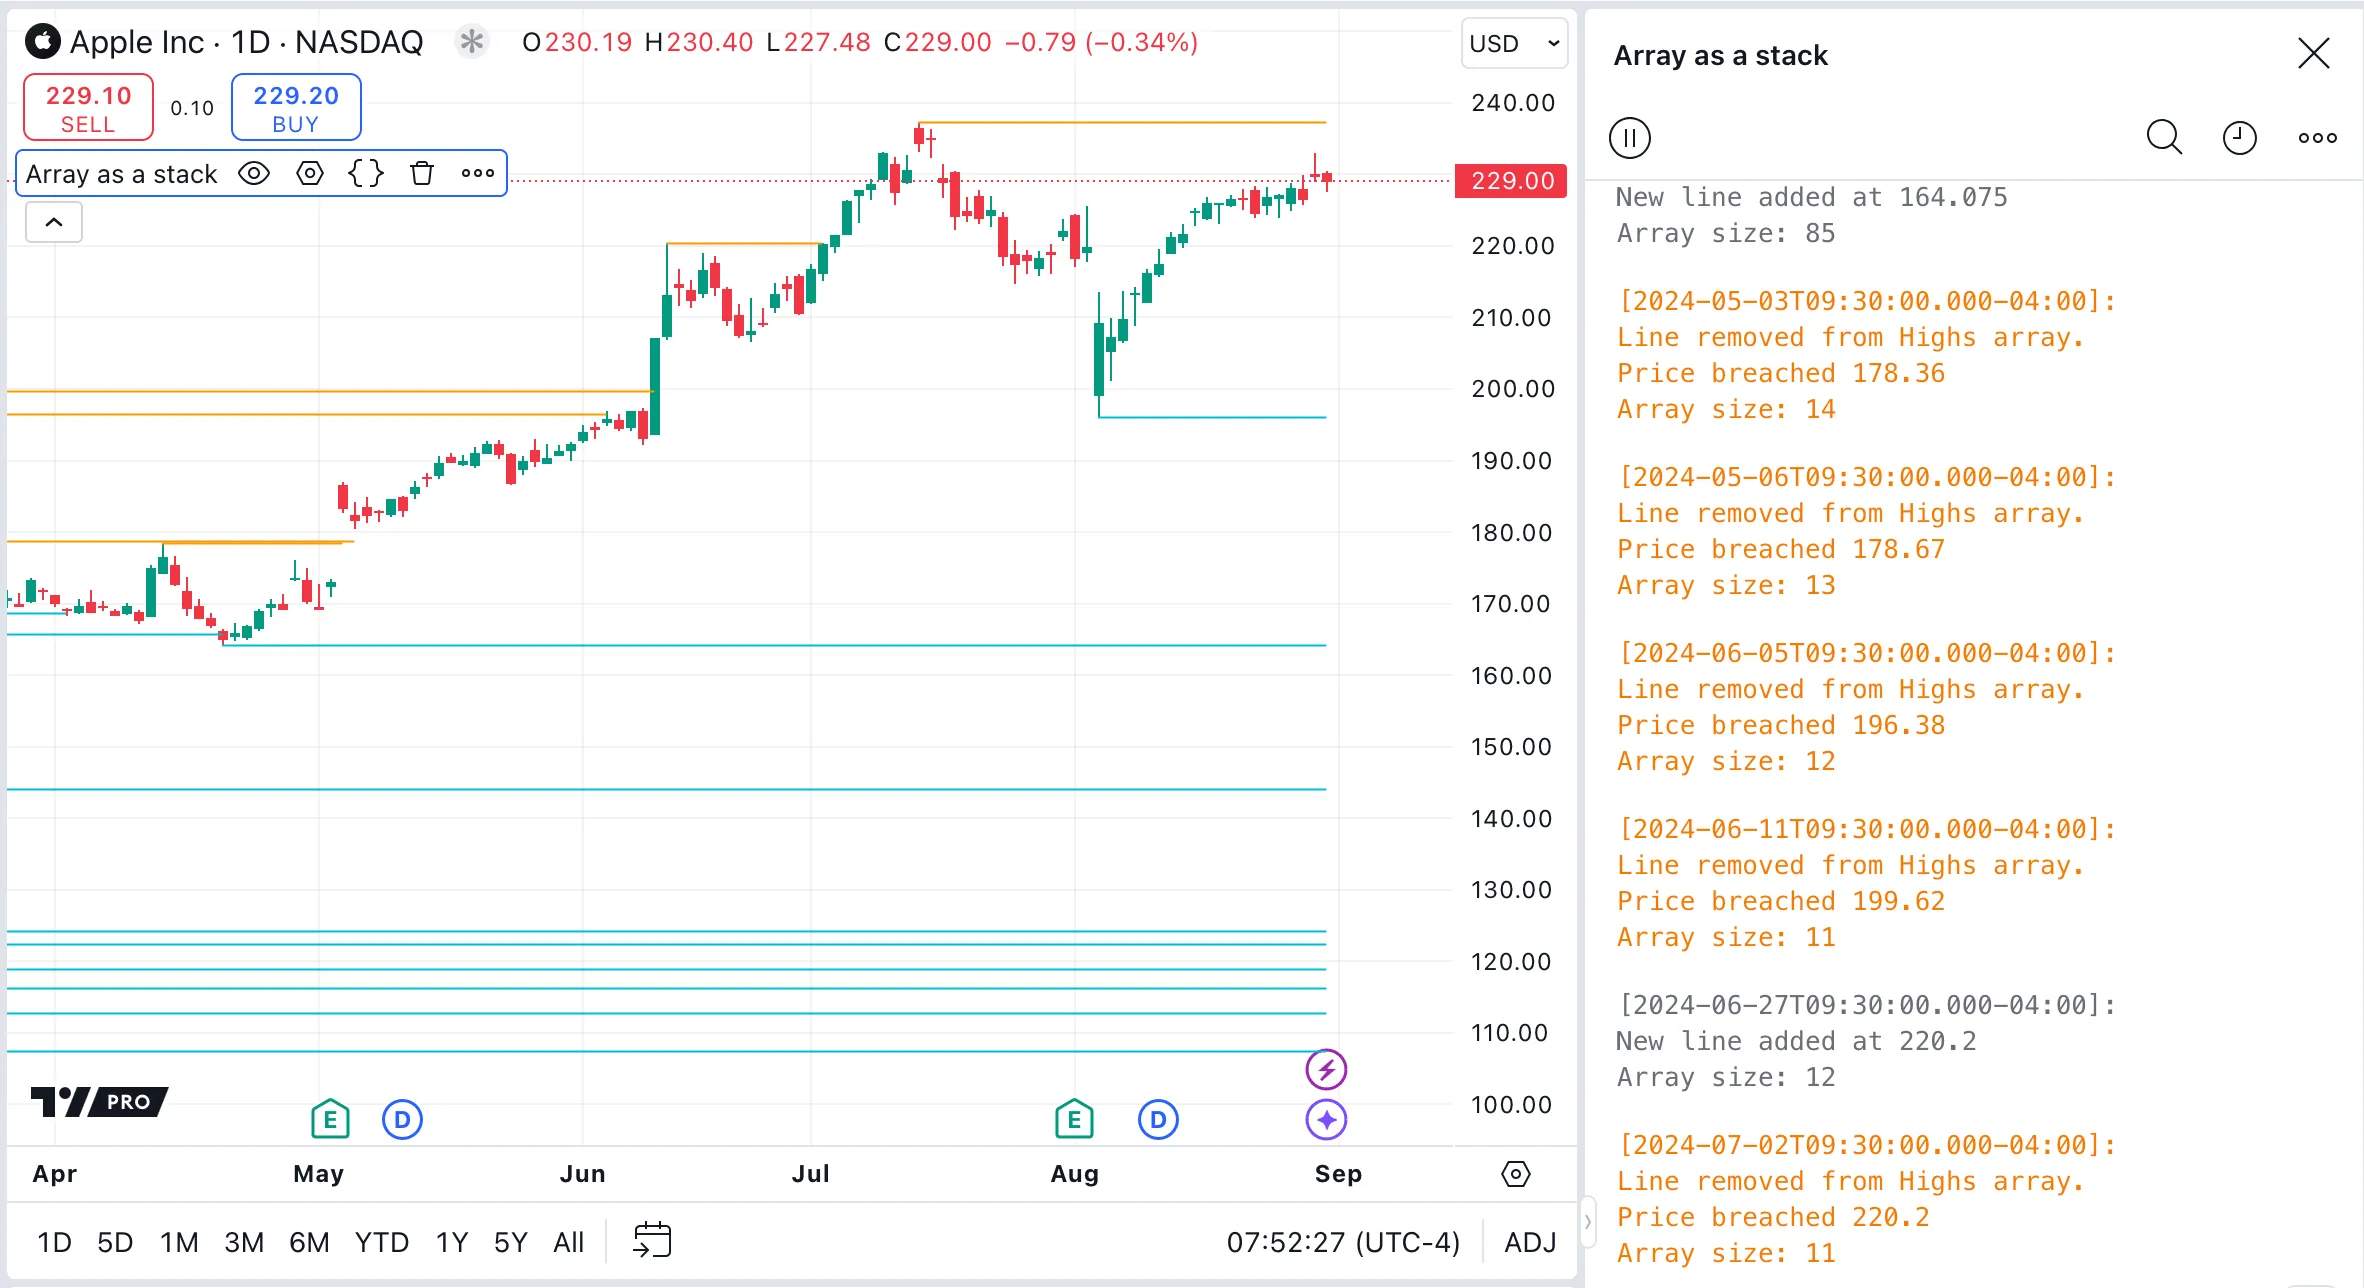
The script below updates a previous example script from the section on queues and stacks to add logging. It uses arrays as stacks to track lines drawn from pivot points. When a pivot occurs, the script adds a new line to the stack and continues to extend the lines on each bar until an intersection with price occurs. If an intersection is found, the script removes (pops) the intersected line from the stack, meaning it will no longer be extended with new bars.
The messages in the Pine Logs pane are time stamped and offer detailed information about when elements are added to and removed from the arrays, the current size of the arrays, and the specific prices at which elements were added.
Can I use matrices or multidimensional arrays in Pine Script?
Pine Script does not directly support multidimensional arrays; however, it provides matrices and user-defined types (UDTs). Programmers can use these data structures to create and manipulate complex datasets.
Matrices
Using UDTs for multidimensional structures
For more information, see the sections on Matrices, Maps, and Objects in the User Manual.
How can I debug objects?
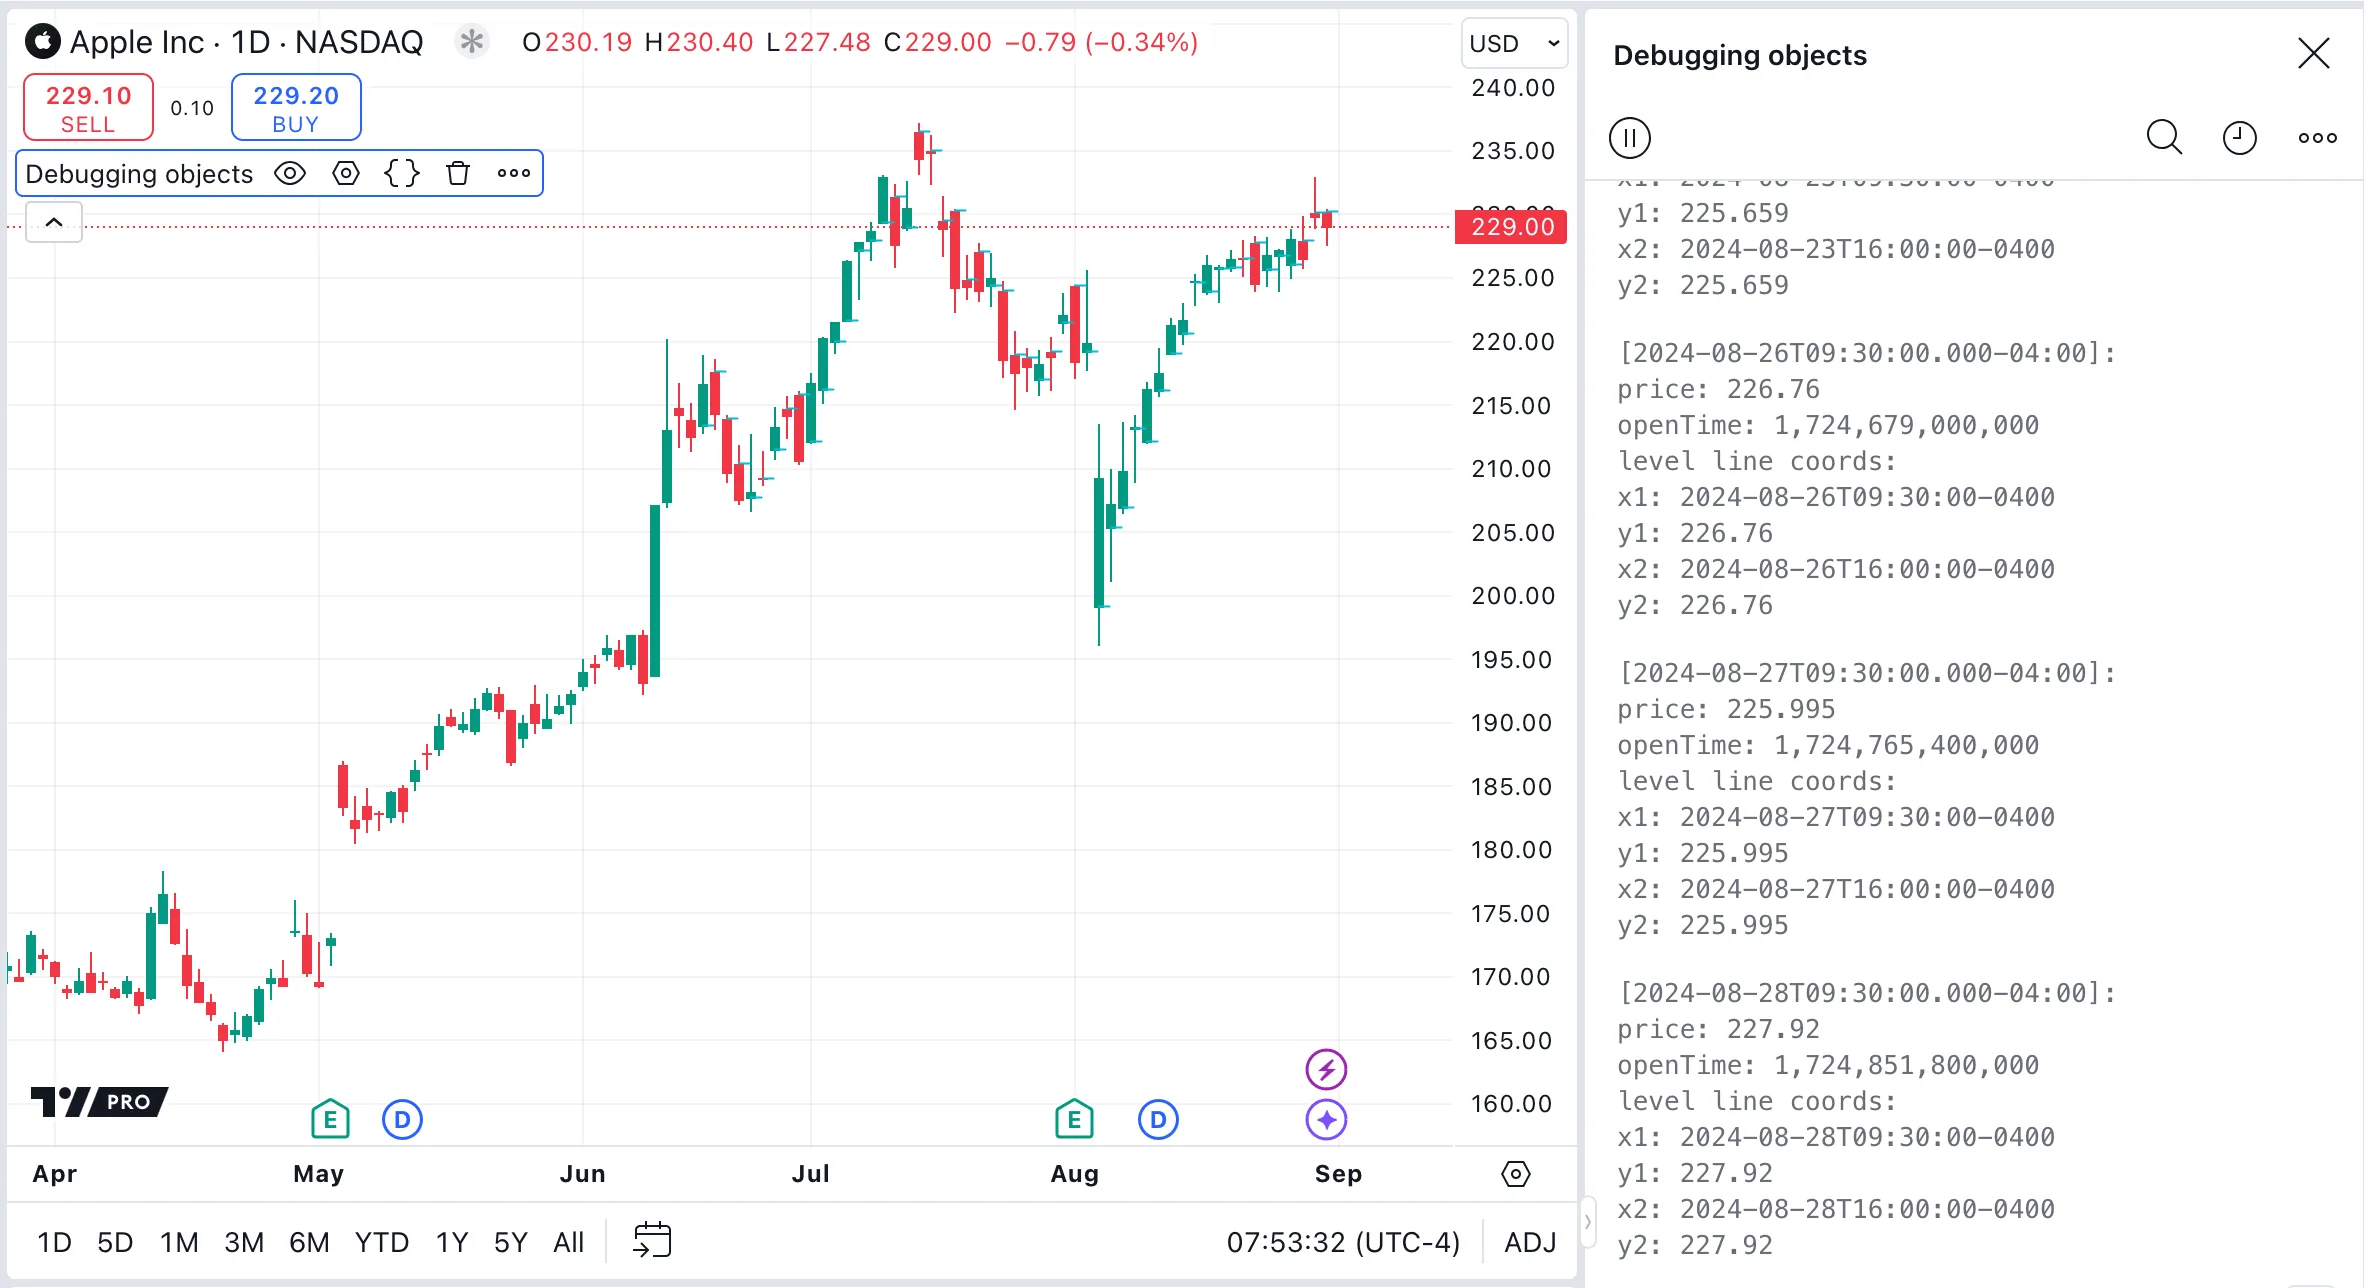
To debug objects, create custom functions that break down an object into its constituent fields and convert these fields into strings. See the Debugging section of the User Manual for information about methods to display debug information. In particular, Pine Logs can display extensive and detailed debug information. See the FAQ section about debugging arrays using Pine Logs for an explanation of using logs for debugging.
In our example script, we create a user-defined type (UDT) named openLine, which includes fields such as price, openTime, and a line object called level.
On the first bar of each session, the script initializes a new openLine instance. This object tracks the session’s opening price and time, and it draws a line at the open price, extending from the session’s start to
its close. An array stores each openLine object. A custom function debugOpenLine() breaks an openLine object into its individual fields, converts the fields to strings, and then logs a message that displays these strings in the console.
