Profiling and optimization
Introduction
Pine Script® is a cloud-based compiled language geared toward efficient repeated script execution. When a user adds a Pine script to a chart, it executes numerous times, once for each available bar or tick in the data feeds it accesses, as explained in this manual’s Execution model page.
The Pine Script compiler automatically performs several internal optimizations to accommodate scripts of various sizes and help them run smoothly. However, such optimizations do not prevent performance bottlenecks in script executions. As such, it’s up to programmers to profile a script’s runtime performance and identify ways to modify critical code blocks and lines when they need to improve execution times.
This page covers how to profile and monitor a script’s runtime and executions with the Pine Profiler and explains some ways programmers can modify their code to optimize runtime performance.
For a quick introduction, see the following video, where we profile an example script and optimize it step-by-step, examining several common script inefficiencies and explaining how to avoid them along the way:
Pine Profiler
Before diving into optimization, it’s prudent to evaluate a script’s runtime and pinpoint bottlenecks, i.e., areas in the code that substantially impact overall performance. With these insights, programmers can ensure they focus on optimizing where it truly matters instead of spending time and effort on low-impact code.
Enter the Pine Profiler, a powerful utility that analyzes the executions of all significant code lines and blocks in a script and displays helpful performance information next to the lines inside the Pine Editor. By inspecting the Profiler’s results, programmers can gain a clearer perspective on a script’s overall runtime, the distribution of runtime across its significant code regions, and the critical portions that may need extra attention and optimization.
Profiling a script
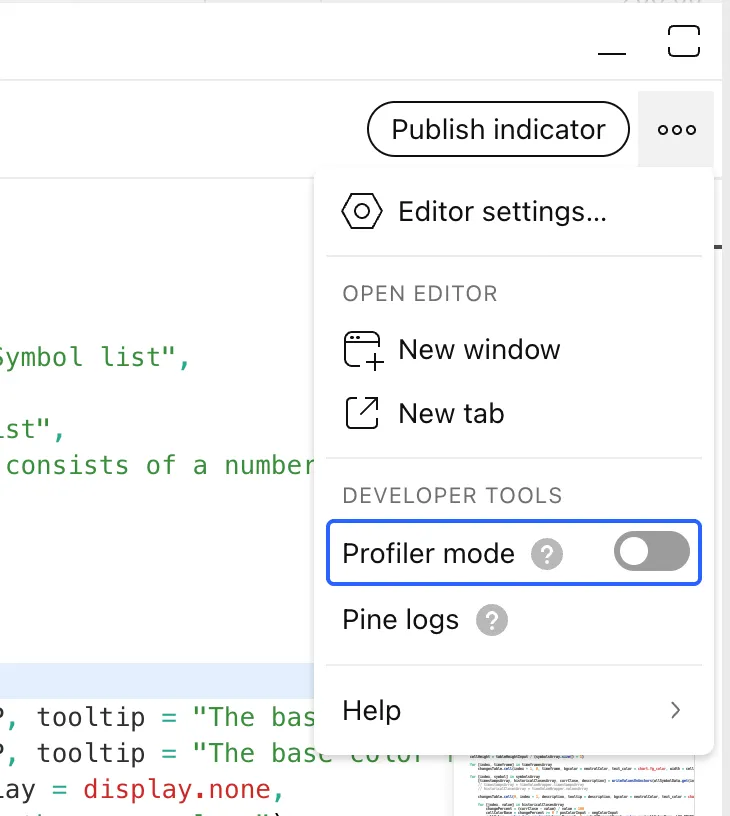
The Pine Profiler can analyze the runtime performance of any editable script coded in Pine Script v6. To profile a script, add it to the chart, open the source code in the Pine Editor, and turn on the “Profiler mode” switch in the dropdown accessible via the “More” option in the top-right corner:
We will use the script below for our initial profiling example, which
calculates a custom oscillator based on average distances from the
close
price to upper and lower percentiles
over lengthInput bars. It includes a few different types of
significant code regions, which come with some differences in
interpretation while profiling:
Once enabled, the Profiler collects information from all executions of the script’s significant code lines and blocks, then displays bars and approximate runtime percentages to the left of the code lines inside the Pine Editor:
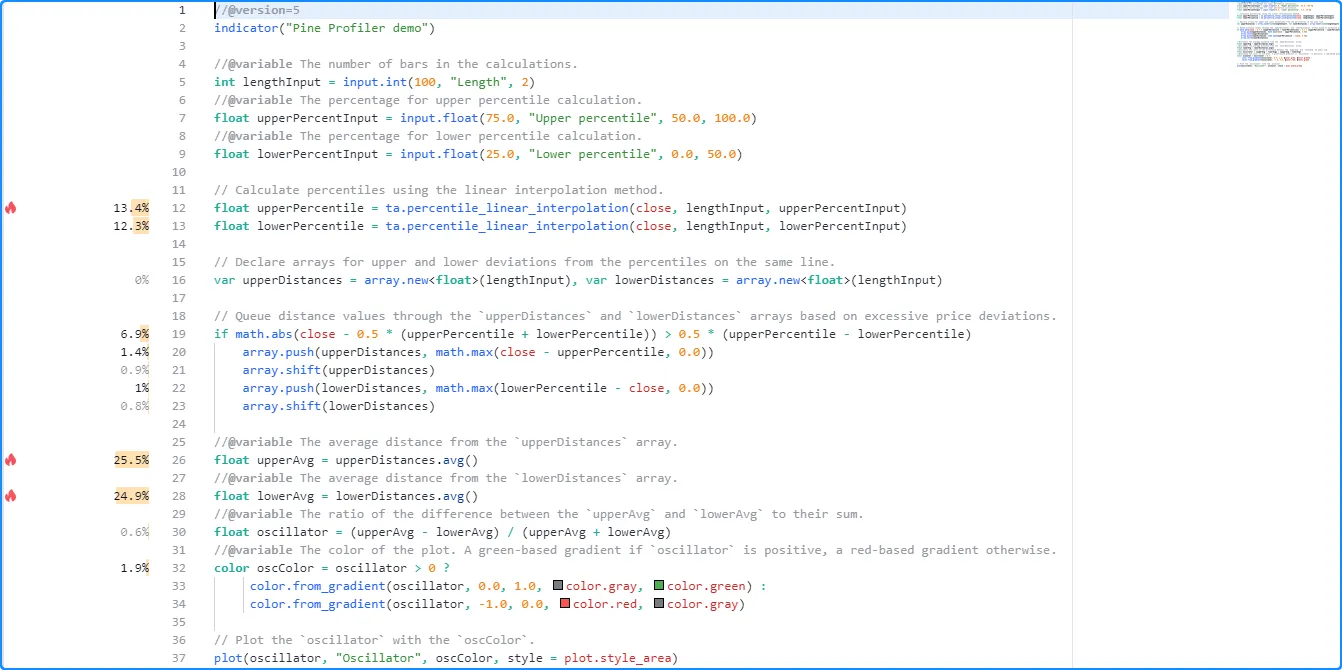
Note that:
- The Profiler tracks every execution of a significant code region, including the executions on realtime ticks. Its information updates over time as new executions occur.
- Profiler results do not appear for script declaration statements, type declarations, other insignificant code lines such as variable declarations with no tangible impact, unused code that the script’s outputs do not depend on, or repetitive code that the compiler optimizes during translation. See this section for more information.
When a script contains at least four significant lines of code, the Profiler will include “flame” icons next to the top three code regions with the highest performance impact. If one or more of the highest-impact code regions are outside the lines visible inside the Pine Editor, a “flame” icon and a number indicating how many critical lines are outside the view will appear at the top or bottom of the left margin. Clicking the icon will vertically scroll the Editor’s window to show the nearest critical line:

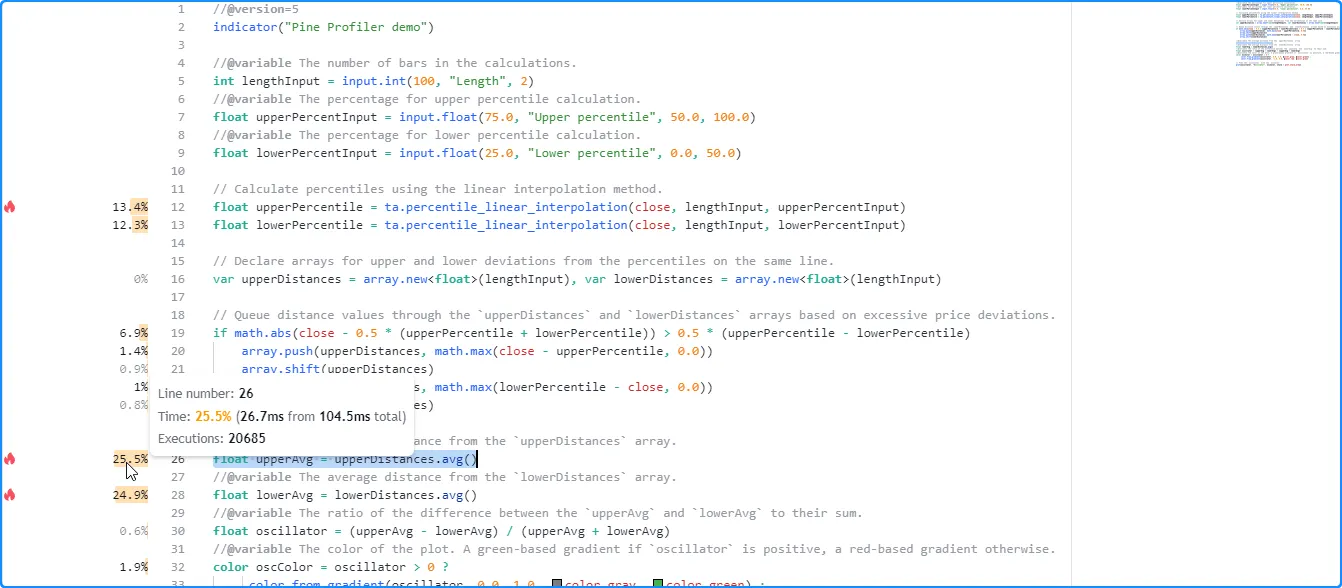
Hovering the mouse pointer over the space next to a line highlights the analyzed code and exposes a tooltip with additional information, including the time spent and the number of executions. The information shown next to each line and in the corresponding tooltip depends on the profiled code region. The section below explains different types of code the Profiler analyzes and how to interpret their performance results.
Interpreting profiled results
Single-line results
For a code line containing single-line expressions, the Profiler bar and displayed percentage represent the relative portion of the script’s total runtime spent on that line. The corresponding tooltip displays three fields:
- The “Line number” field indicates the analyzed code line.
- The “Time” field shows the runtime percentage for the line of code, the runtime spent on that line, and the script’s total runtime.
- The “Executions” field shows the number of times that specific line executed while running the script.
Here, we hovered the pointer over the space next to line 12 of our profiled code to view its tooltip:

Note that:
- The time information for the line represents the time spent completing all executions, not the time spent on a single execution.
- To estimate the average time spent per execution, divide the line’s time by the number of executions. In this case, the tooltip shows that line 12 took about 14.1 milliseconds to execute 20,685 times, meaning the average time per execution was approximately 14.1 ms / 20685 = 0.0006816534 milliseconds (0.6816534 microseconds).
When a line of code consists of more than one expression separated by commas, the number of executions shown in the tooltip represents the sum of each expression’s total executions, and the time value displayed represents the total time spent evaluating all the line’s expressions.
For instance, this global line from our initial example includes two variable declarations separated by commas. Each uses the var keyword, meaning the script only executes them once on the first available bar. As we see in the Profiler tooltip for the line, it counted two executions (one for each expression), and the time value shown is the combined result from both expressions on the line:

Note that:
- When analyzing scripts with more than one expression on the same line, we recommend moving each expression to a separate line for more detailed insights while profiling, namely if they may contain higher-impact calculations.
When using line wrapping for readability or stylistic purposes, the Profiler considers all portions of a wrapped line as part of the first line where it starts in the Pine Editor.
For example, although this code from our initial script occupies more than one line in the Pine Editor, it’s still treated as a single line of code, and the Profiler tooltip displays single-line results, with the “Line number” field showing the first line in the Editor that the wrapped line occupies:

Code block results
For a line at the start of a loop or conditional structure, the Profiler bar and percentage represent the relative portion of the script’s runtime spent on the entire code block, not just the single line. The corresponding tooltip displays four fields:
- The “Code block range” field indicates the range of lines included in the structure.
- The “Time” field shows the code block’s runtime percentage, the time spent on all block executions, and the script’s total runtime.
- The “Line time” field shows the runtime percentage for the
block’s initial line, the time spent on that line, and the
script’s total runtime. The interpretation differs for
switch
blocks or
if
blocks with
else ifstatements, as the values represent the total time spent on all the structure’s conditional statements. See below for more information. - The “Executions” field shows the number of times the code block executed while running the script.
Here, we hovered over the space next to line 19 in our initial script,
the beginning of a simple
if
structure without else if
statements. As we see below, the tooltip shows performance information
for the entire code block and the current line:

Note that:
- The “Time” field shows that the total time spent evaluating the structure 20,685 times was 7.2 milliseconds.
- The “Line time” field indicates that the runtime spent on the first line of this if structure was about three milliseconds.
Users can also inspect the results from lines and nested blocks within a code block’s range to gain more granular performance insights. Here, we hovered over the space next to line 20 within the code block to view its single-line result:

Note that:
- The number of executions shown is less than the result for the
entire code block, as the condition that controls the execution
of this line does not return
trueall the time. The opposite applies to the code inside loops since each execution of a loop statement can trigger several executions of the loop’s local block.
When profiling a
switch
structure or an
if
structure that includes else if
statements, the “Line time” field will show the time spent executing
all the structure’s conditional expressions, not just the
block’s first line. The results for the lines inside the code block
range will show runtime and executions for each local block. This
format is necessary for these structures due to the Profiler’s
calculation and display constraints. See
this section for more information.
For example, the “Line time” for the switch structure in this script represents the time spent evaluating all four conditional statements within its body, as the Profiler cannot track them separately. The results for each line in the code block’s range represent the performance information for each local block:

When the conditional logic in such structures involves significant
calculations, programmers may require more granular performance
information for each calculated condition. An effective way to achieve
this analysis is to use nested
if blocks
instead of the more compact
switch
or if...else if
structures. For example, instead of:
or:
one can use nested if blocks for more in-depth profiling while maintaining the same logical flow:
Below, we changed the previous switch example to an equivalent nested if structure. Now, we can view the runtime and executions for each significant part of the conditional pattern individually:

Note that:
- This same process can also apply to ternary operations. When a complex ternary expression’s operands contain significant calculations, reorganizing the logic into a nested if structure allows more detailed Profiler results, making it easier to spot critical parts.
User-defined function calls
User-defined functions and methods are functions written by users. They encapsulate code sequences that a script may execute several times. Users often write functions and methods for improved code modularity, reusability, and maintainability.
The indented lines of code within a function represent its local scope, i.e., the sequence that executes each time the script calls it. Unlike code in a script’s global scope, which a script evaluates once on each execution, the code inside a function may activate zero, one, or multiple times on each script execution, depending on the conditions that trigger the calls, the number of calls that occur, and the function’s logic.
This distinction is crucial to consider while interpreting Profiler results. When a profiled code contains user-defined function or method calls:
- The results for each function call reflect the runtime allocated toward it and the total number of times the script activated that specific call.
- The time and execution information for all local code inside a function’s scope reflects the combined results from all calls to the function.
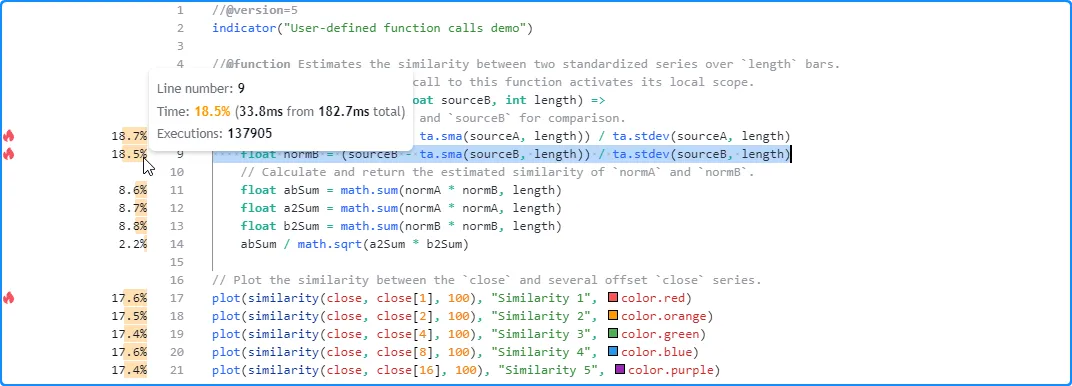
This example contains a user-defined similarity() function that
estimates the similarity of two series, which the script calls only
once from the global scope on each execution. In this case, the
Profiler’s results for the code inside the function’s body correspond
to that specific call:

Let’s increase the number of times the script calls the function each time it executes. Here, we changed the script to call our user-defined function five times:
In this case, the local code results no longer correspond to a single
evaluation per script execution. Instead, they represent the combined
runtime and executions of the local code from all five calls. As we
see below, the results after running this version of the script across
the same data show 137,905 executions of the local code, five times
the number from when the script only contained one similarity()
function call:
When requesting other contexts
Pine scripts can request data from other contexts, i.e., different
symbols, timeframes, or data modifications than what the chart’s data
uses by calling the request.*() family of functions or specifying an
alternate timeframe in the
indicator()
declaration statement.
When a script requests data from another context, it evaluates all required scopes and calculations within that context, as explained in the Other timeframes and data page. This behavior can affect the runtime of a script’s code regions and the number of times they execute.
The Profiler information for any code line or block represents the results from executing the code in all necessary contexts, which may or may not include the chart’s data. Pine Script determines which contexts to execute code within based on the calculations required by a script’s data requests and outputs.
Let’s look at a simple example. This initial script only uses the
chart’s data for its calculations. It declares a pricesArray variable
with the
varip
keyword, meaning the
array
assigned to it persists across the data’s history and all available
realtime ticks. On each execution, the script calls
array.push()
to push a new
close
value into the
array,
and it plots the array’s size.
After profiling the script across all the bars on an intraday chart, we
see that the number of elements in the pricesArray corresponds to the
number of executions the Profiler shows for the
array.push()
call on line 8:

Now, let’s try evaluating the size of the pricesArray from another
context instead of using the chart’s data. Below, we’ve added a
request.security()
call with
array.size(pricesArray)
as its expression argument to retrieve the value calculated on the
“1D” timeframe and plotted that result instead.
In this case, the number of executions the Profiler shows on line 8
still corresponds to the number of elements in the pricesArray.
However, it did not execute the same number of times since the script
did not require the chart’s data in the calculations. It only needed
to initialize the
array
and evaluate
array.push()
across all the requested daily data, which has a different number of
price updates than our current intraday chart:

Note that:
- The requested EOD data in this example had fewer data points than our intraday chart, so the array.push() call required fewer executions in this case. However, EOD feeds do not have history limitations, meaning it’s also possible for requested HTF data to span more bars than a user’s chart, depending on the timeframe, the data provider, and the user’s plan.
If this script were to plot the array.size() value directly in addition to the requested daily value, it would then require the creation of two arrays (one for each context) and the execution of array.push() across both the chart’s data and the data from the daily timeframe. As such, the declaration on line 5 will execute twice, and the results on line 8 will reflect the time and executions accumulated from evaluating the array.push() call across both separate datasets:

It’s important to note that when a script calls a
user-defined function or
method
that contains request.*() calls in its local scope, the script’s
translated form extracts the request.*() calls outside the scope
and encapsulates the expressions they depend on within separate
functions. When the script executes, it evaluates the required
request.*() calls first, then passes the requested data to a
modified form of the
user-defined function.
Since the translated script executes a
user-defined function’s data requests separately before evaluating non-requested
calculations in its local scope, the Profiler’s results for lines
containing calls to the function will not include the time spent on
its request.*() calls or their required expressions.
As an example, the following script contains a user-defined
getCompositeAvg() function with a
request.security()
call that requests the
math.avg()
of 10
ta.wma()
calls with different length arguments from a specified symbol. The
script uses the function to request the average result using a Heikin Ashi
ticker ID:
After profiling the script, users might be surprised to see that the
runtime results shown inside the function’s body heavily exceed the
results shown for the single getCompositeAvg() call:

The results appear this way since the translated script includes internal modifications that moved the request.security() call and its expression outside the function’s scope, and the Profiler has no way to represent the results from those calculations other than displaying them next to the request.security() line in this scenario. The code below roughly illustrates how the translated script looks:
Note that:
- The
secExpr()code represents the separate function used by request.security() to calculate the required expression in the requested context. - The
request.security()
call takes place in the outer scope, outside the
getCompositeAvg()function. - The translation substantially reduced the local code of
getCompositeAvg(). It now solely returns a value passed into it, as all the function’s required calculations take place outside its scope. Due to this reduction, the function call’s performance results will not reflect any of the time spent on the data request’s required calculations.
Insignificant, unused, and redundant code
When inspecting a profiled script’s results, it’s crucial to
understand that not all code in a script necessarily impacts runtime
performance. Some code has no direct performance impact, such as a
script’s declaration statement and
type
declarations. Other code regions with insignificant expressions, such as
most input.*() calls, variable references, or
variable declarations without significant calculations, have little to no effect
on a script’s runtime. Therefore, the Profiler will not display
performance results for these types of code.
Additionally, Pine scripts do not execute code regions that their outputs (plots, drawings, logs, etc.) do not depend on, as the compiler automatically removes them during translation. Since unused code regions have zero impact on a script’s performance, the Profiler will not display any results for them.
The following example contains a barsInRange variable and a
for loop
that adds 1 to the variable’s value for each historical
close
price between the current
high
and low
over lengthInput bars. However, the script does not use these
calculations in its outputs, as it only
plots the
close
price. Consequently, the script’s compiled form discards that
unused code and only considers the
plot(close)
call.
The Profiler does not display any results for this script since it does not execute any significant calculations:

Note that:
- Although this script does not use the input.int() from line 5 and discards all its associated calculations, the “Length” input will still appear in the script’s settings, as the compiler does not completely remove unused inputs.
If we change the script to plot the barsInRange value instead, the
declared variables and the
for loop
are no longer unused since the output depends on them, and the Profiler
will now display performance information for that code:

Note that:
- The Profiler does not show performance information for the
lengthInputdeclaration on line 5 or thebarsInRangedeclaration on line 8 since the expressions on these lines do not impact the script’s performance.
When possible, the compiler also simplifies certain instances of redundant code in a script, such as some forms of identical expressions with the same fundamental type values. This optimization allows the compiled script to only execute such calculations once, on the first occurrence, and reuse the calculated result for each repeated instance that the outputs depend on.
If a script contains repetitive code and the compiler simplifies it, the Profiler will only show results for the first occurrence of the code since that’s the only time the script requires the calculation.
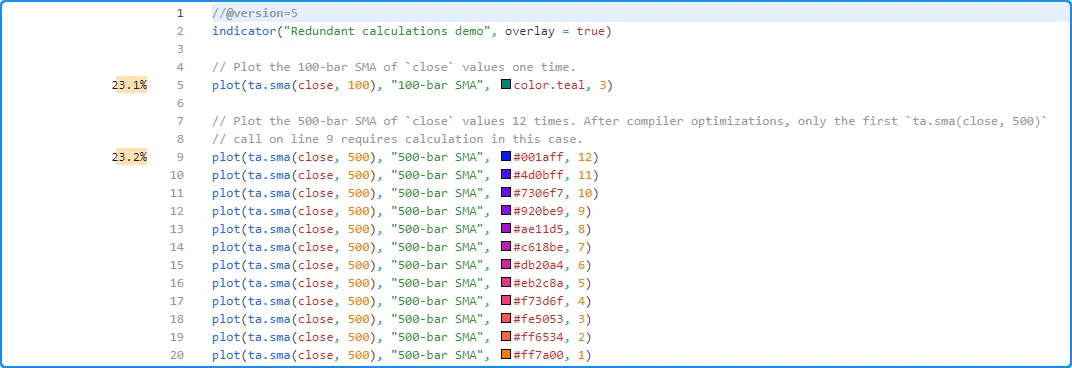
For example, this script contains a code line that plots the value of ta.sma(close, 100) and 12 code lines that plot the value of ta.sma(close, 500):
Since the last 12 lines all contain identical ta.sma() calls, the compiler can automatically simplify the script so that it only needs to evaluate ta.sma(close, 500) once per execution rather than repeating the calculation 11 more times.
As we see below, the Profiler only shows results for lines 5 and 9. These are the only parts of the code requiring significant calculations since the ta.sma() calls on lines 10-20 are redundant in this case:
Another type of repetitive code optimization occurs when a script contains two or more user-defined functions or methods with identical compiled forms. In such a case, the compiler simplifies the script by removing the redundant functions, and the script will treat all calls to the redundant functions as calls to the first defined version. Therefore, the Profiler will only show local code performance results for the first function since the discarded “clones” will never execute.
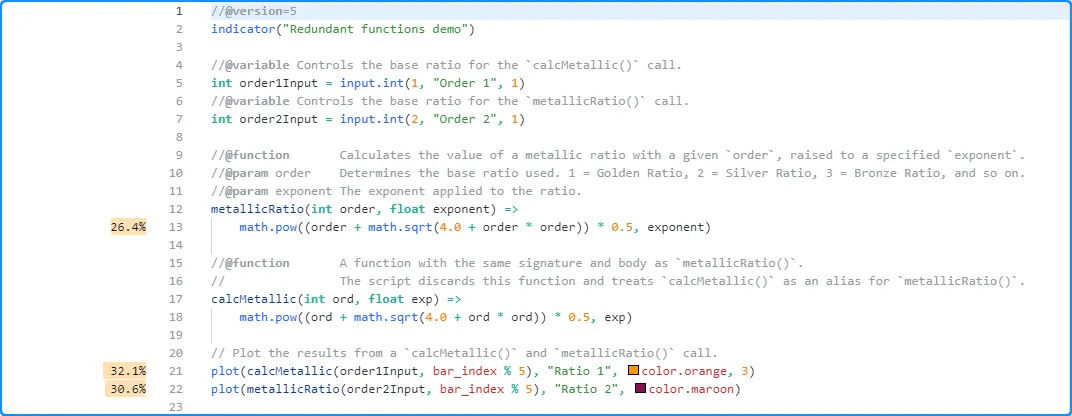
For instance, the script below contains two
user-defined functions, metallicRatio() and calcMetallic(), that calculate a
metallic ratio of a given
order raised to a specified exponent:
Despite the differences in the function and parameter names, the two
functions are otherwise identical, which the compiler detects while
translating the script. In this case, it discards the redundant
calcMetallic() function, and the compiled script treats the
calcMetallic() call as a metallicRatio() call.
As we see here, the Profiler shows performance information for the
calcMetallic() and metallicRatio() calls on lines 21 and 22, but it
does not show any results for the local code of the calcMetallic()
function on line 18. Instead, the Profiler’s information on line 13
within the metallicRatio() function reflects the local code results
from both
function calls:
A look into the Profiler’s inner workings
The Pine Profiler wraps all necessary code regions with specialized internal functions to track and collect required information across script executions. It then passes the information to additional calculations that organize and display the performance results inside the Pine Editor. This section gives users a peek into how the Profiler applies internal functions to wrap Pine code and collect performance data.
There are two main internal (non-Pine) functions the Profiler wraps
significant code with to facilitate runtime analysis. The first function
retrieves the current system time at specific points in the script’s
execution, and the second maps cumulative elapsed time and execution
data to specific code regions. We represent these functions in this
explanation as System.timeNow() and registerPerf() respectively.
When the Profiler detects code that requires analysis, it adds
System.timeNow() above the code to get the initial time before
execution. Then, it adds registerPerf() below the code to map and
accumulate the elapsed time and number of executions. The elapsed time
added on each registerPerf() call is the System.timeNow() value
after the execution minus the value before the execution.
The following pseudocode outlines this process for a
single line of code, where _startX represents the starting time for
the lineX line:
The process is similar for
code blocks. The difference is that the registerPerf() call maps the
data to a range of lines rather than a single line. Here, lineX
represents the first line in the code block, and lineY represents
the block’s last line:
Note that:
- In the above snippets,
long,System.timeNow(), andregisterPerf()represent internal code, not Pine Script code.
Let’s now look at how the Profiler wraps a full script and all its significant code. We will start with this script, which calculates three pseudorandom series and displays their average result. The script utilizes an object of a user-defined type to store a pseudorandom state, a method to calculate new values and update the state, and an if…else if structure to update each series based on generated values:
The Profiler will wrap the entire script and all necessary code regions, excluding any insignificant, unused, or redundant code, with the aforementioned internal functions to collect performance data. The pseudocode below demonstrates how this process applies to the above script:
Note that:
- This example is pseudocode that provides a basic outline of
the internal calculations the Profiler applies to collect
performance data. Saving this example in the Pine Editor will
result in a compilation error since
long,System.timeNow(), andregisterPerf()do not represent Pine Script code. - These internal calculations that the Profiler wraps a script with require additional computational resources, which is why a script’s runtime increases while profiling. Programmers should always interpret the results as estimates since they reflect a script’s performance with the extra calculations included.
After running the wrapped script to collect performance data, additional internal calculations organize the results and display relevant information inside the Pine Editor:
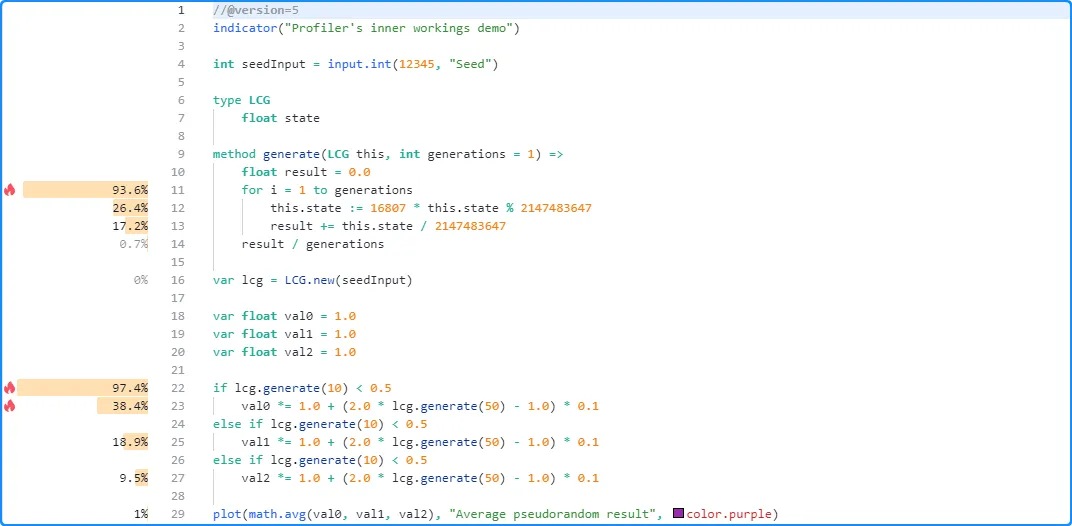
The “Line time” calculation for
code blocks also occurs at this stage, as the Profiler cannot
individually wrap loop
headers or the conditional statements in
if or
switch
structures. This field’s value represents the difference between a
block’s total time and the sum of its local code times, which is why
the “Line time” value for a
switch
block or an
if block
with else if
expressions represents the time spent on all the structure’s
conditional statements, not just the block’s initial line of code. If
a programmer requires more granular information for each conditional
expression in such a block, they can reorganize the logic into a
nested
if
structure, as explained
here.
Profiling across configurations
When a code’s time complexity is not constant or its execution pattern varies with its inputs, function arguments, or available data, it’s often wise to profile the code across different configurations and data feeds for a more well-rounded perspective on its general performance.
For example, this simple script uses a
for loop
to calculate the sum of squared distances between the current
close
price and lengthInput previous prices, then plots the square root of that sum on each bar. In this case, the lengthInput directly
impacts the calculation’s runtime since it determines the number of
times the loop executes its local code:
Let’s try profiling this script with different lengthInput values.
First, we’ll use the default value of 25. The Profiler’s results for
this specific run show that the script completed 20,685 executions in
about 96.7 milliseconds:

Here, we’ve increased the input’s value to 50 in the script’s settings. The results for this run show that the script’s total runtime was 194.3 milliseconds, close to twice the time from the previous run:

In the next run, we changed the input’s value to 200. This time, the Profiler’s results show that the script finished all executions in approximately 0.8 seconds, around four times the previous run’s time:

We can see from these observations that the script’s runtime appears to
scale linearly with the lengthInput value, excluding other factors
that may affect performance, as one might expect since the bulk of the
script’s calculations occur within the loop and the input’s value
controls how many times the loop must execute.
Repetitive profiling
The runtime resources available to a script vary over time. Consequently, the time it takes to evaluate a code region, even one with constant complexity, fluctuates across executions, and the cumulative performance results shown by the Profiler will vary with each independent script run.
Users can enhance their analysis by restarting a script several times and profiling each independent run. Averaging the results from each profiled run and evaluating the dispersion of runtime results can help users establish more robust performance benchmarks and reduce the impact of outliers (abnormally long or short runtimes) in their conclusions.
Incorporating a dummy input (i.e., an input that does nothing) into a script’s code is a simple technique that enables users to restart it while profiling. The input will not directly affect any calculations or outputs. However, as the user changes its value in the script’s settings, the script restarts and the Profiler re-analyzes the executed code.
For example, this script
queues pseudorandom values with a constant seed through an
array
with a fixed size, and it calculates and plots the array.avg()
value on each bar. For profiling purposes, the script includes a
dummyInput variable with an
input.int()
value assigned to it. The input does nothing in the code aside from
allowing us to restart the script each time we change its value:
After the first script run, the Profiler shows that it took 308.6 milliseconds to execute across all of the chart’s data:

Now, let’s change the dummy input’s value in the script’s settings to restart it without changing the calculations. This time, it completed the same code executions in 424.6 milliseconds, 116 milliseconds longer than the previous run:

Restarting the script again yields another new result. On the third run, the script finished all code executions in 227.4 milliseconds, the shortest time so far:

After repeating this process several times and documenting the results from each run, one can manually calculate their average to estimate the script’s expected total runtime:
AverageTime = (time1 + time2 + ... + timeN) / N
Optimization
Code optimization, not to be confused with indicator or strategy optimization, involves modifying a script’s source code for improved execution time, resource efficiency, and scalability. Programmers may use various approaches to optimize a script when they need enhanced runtime performance, depending on what a script’s calculations entail.
Fundamentally, most techniques one will use to optimize Pine code involve reducing the number of times critical calculations occur or replacing significant calculations with simplified formulas or built-ins. Both of these paradigms often overlap.
The following sections explain several straightforward concepts programmers can apply to optimize their Pine Script code.
Using built-ins
Pine Script features a variety of built-in functions and variables that help streamline script creation. Many of Pine’s built-ins feature internal optimizations to help maximize efficiency and minimize execution time. As such, one of the simplest ways to optimize Pine code is to utilize these efficient built-ins in a script’s calculations when possible.
Let’s look at an example where one can replace user-defined
calculations with a concise built-in call to substantially improve
performance. Suppose a programmer wants to calculate the highest value
of a series over a specified number of bars. Someone not familiar with
all of Pine’s built-ins might approach the task using a code like the
following, which uses a loop
on each bar to compare length historical values of a source series:
Alternatively, one might devise a more optimized Pine function by
reducing the number of times the loop executes, as iterating over the
history of the source to achieve the result is only necessary when
specific conditions occur:
The built-in
ta.highest()
function will outperform both of these implementations, as its
internal calculations are highly optimized for efficient execution.
Below, we created a script that plots the results of calling
pineHighest(), fasterPineHighest(), and
ta.highest()
to compare their performance using the
Profiler:
The
profiled results over 20,735 script executions show the call to
pineHighest() took the most time to execute, with a runtime of 57.9
milliseconds, about 69.3% of the script’s total runtime. The
fasterPineHighest() call performed much more efficiently, as it only
took about 16.9 milliseconds, approximately 20.2% of the total runtime,
to calculate the same values.
The most efficient by far, however, was the ta.highest() call, which only required 3.2 milliseconds (~3.8% of the total runtime) to execute across all the chart’s data and compute the same values in this run:
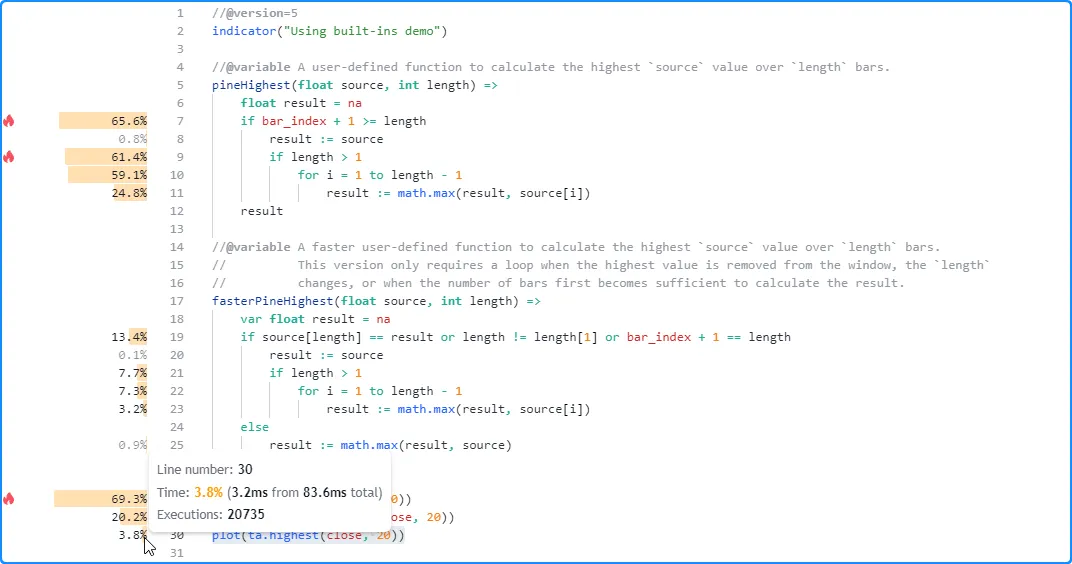
While these results effectively demonstrate that the built-in function
outperforms our
user-defined functions with a small length argument of 20, it’s crucial to
consider that the calculations required by the functions will vary
with the argument’s value. Therefore, we can profile the code while
using
different arguments to gauge how its runtime scales.
Here, we changed the length argument in each function call from 20 to
200 and
profiled the script again to observe the changes in performance. The time spent
on the pineHighest() function in this run increased to about 0.6
seconds (~86% of the total runtime), and the time spent on the
fasterPineHighest() function increased to about 75 milliseconds. The
ta.highest()
function, on the other hand, did not experience a substantial runtime
change. It took about 5.8 milliseconds this time, only a couple of
milliseconds more than the previous run.
In other words, while our
user-defined functions experienced significant runtime growth with a higher
length argument in this run, the change in the built-in
ta.highest()
function’s runtime was relatively marginal in this case, thus further
emphasizing its performance benefits:
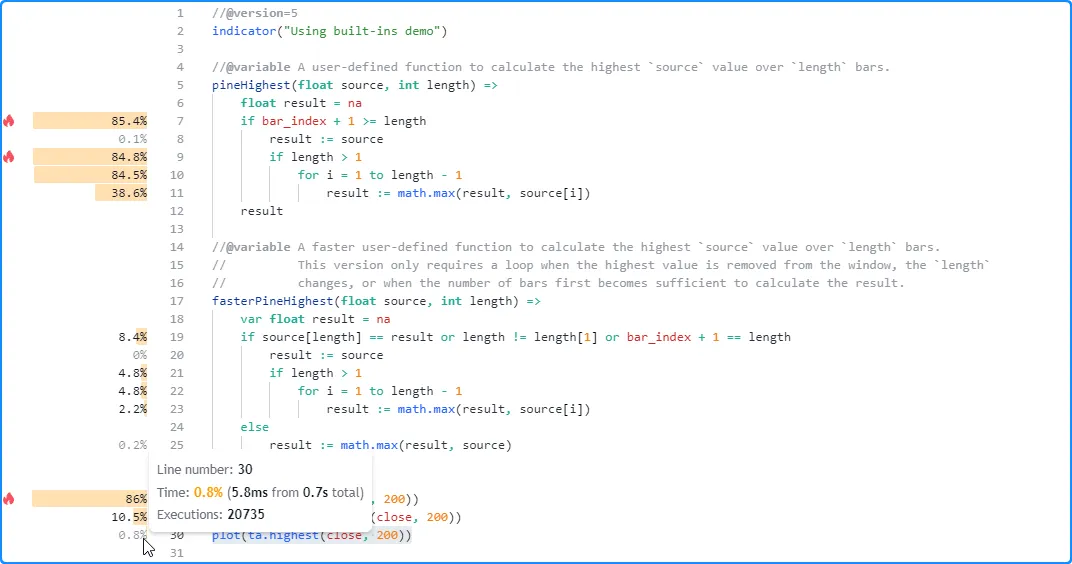
Note that:
- In many scenarios, a script’s runtime can benefit from using built-ins where applicable. However, the relative performance edge achieved from using built-ins depends on a script’s high-impact code and the specific built-ins used. In any case, one should always profile their scripts, preferably several times, when exploring optimized solutions.
- The calculations performed by the functions in this example also depend on the sequence of the chart’s data. Therefore, programmers can gain further insight into their general performance by profiling the script across different datasets as well.
Reducing repetition
The Pine Script compiler can automatically simplify some types of repetitive code without a programmer’s intervention. However, this automatic process has its limitations. If a script contains repetitive calculations that the compiler cannot reduce, programmers can reduce the repetition manually to improve their script’s performance.
For example, this script contains a valuesAbove()
method
that counts the number of elements in an
array
above the element at a specified index. The script plots the number of
values above the element at the last index of a data array with a
calculated plotColor. It calculates the plotColor within a
switch
structure that calls valuesAbove() in all 10 of its conditional
expressions:
The
profiled results for this script show that it spent about 2.5 seconds
executing 21,201 times. The code regions with the highest impact on the
script’s runtime are the
for loop
within the valuesAbove() local scope starting on line 8 and the
switch
block that starts on line 21:
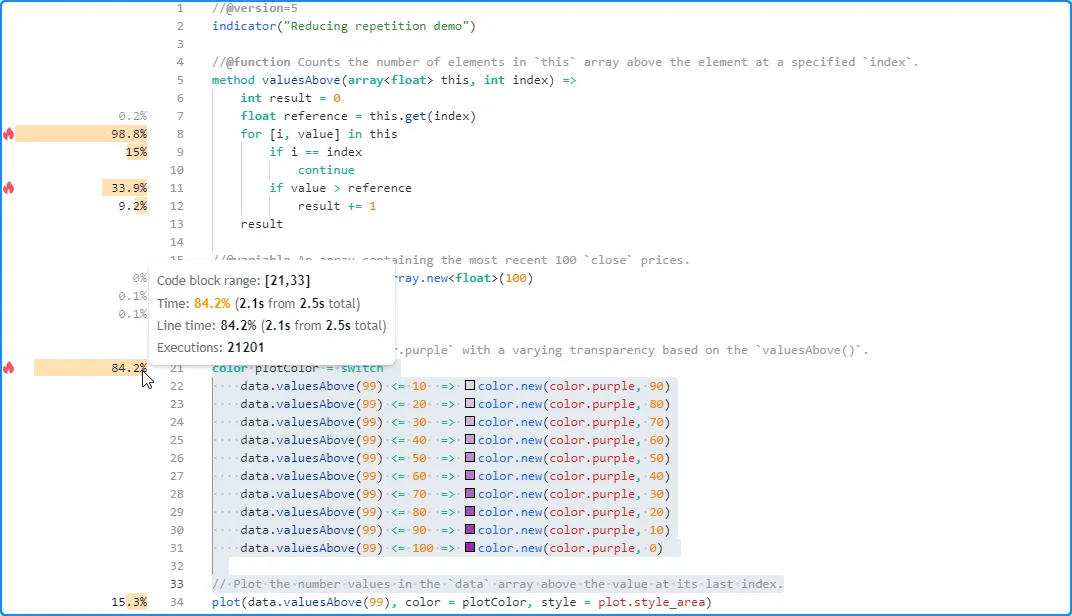
Notice that the number of executions shown for the local code within
valuesAbove() is substantially greater than the number shown for the
code in the script’s global scope, as the script calls the method up to
11 times per execution, and the results for a
function’s local code reflect the combined time and executions from each
separate call:

Although each valuesAbove() call uses the same arguments and returns
the same result, the compiler cannot automatically reduce this code
for us during translation. We will need to do the job ourselves. We can
optimize this script by assigning the value of data.valuesAbove(99) to
a variable and reusing the value in all other areas requiring the
result.
In the version below, we modified the script by adding a count
variable to reference the data.valuesAbove(99) value. The script uses
this variable in the plotColor calculation and the
plot()
call:
With this modification, the
profiled results show a significant improvement in performance, as the script
now only needs to evaluate the valuesAbove() call once per
execution rather than up to 11 separate times:
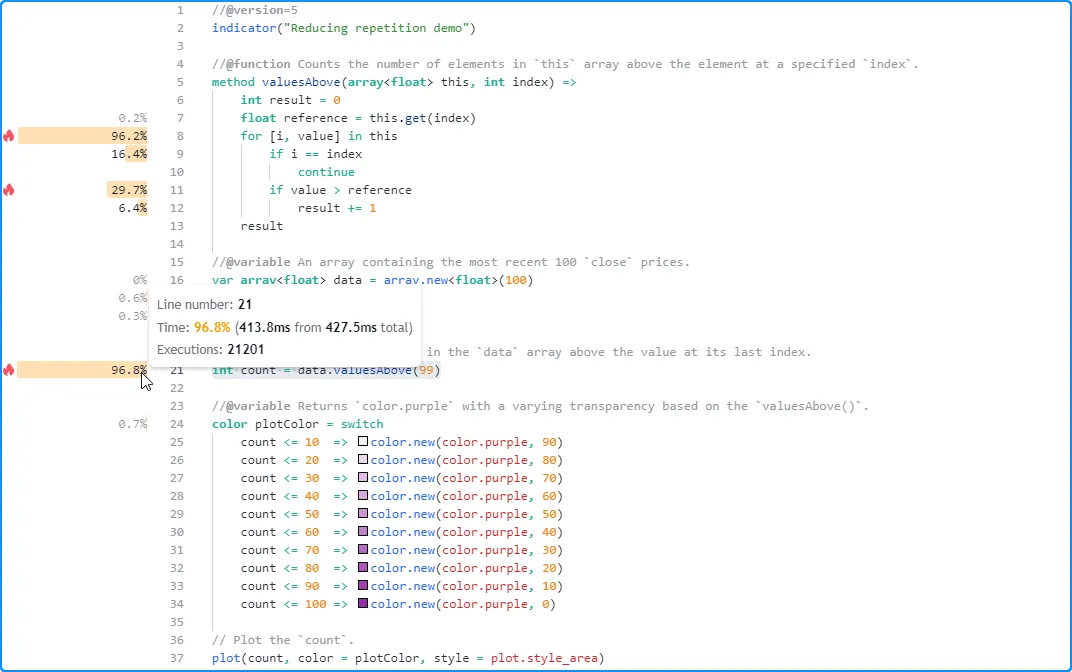
Note that:
- Since this script only calls
valuesAbove()once, the method’s local code will now reflect the results from that specific call. See this section to learn more about interpreting profiled function and method call results.
Minimizing request.*() calls
The built-in functions in the request.*() namespace allow scripts to
retrieve data from
other contexts. While these functions provide utility in many applications,
it’s important to consider that each call to these functions can have a
significant impact on a script’s resource usage.
A single script can contain up to 40 unique calls to the request.*() family of functions, or up to 64 if the user has the Ultimate plan. However, we recommend programmers aim to keep their scripts’ request.*() calls far below this limit to keep the performance impact of their data requests as low as possible.
When a script requests the values of several expressions from the same
context with multiple
request.security()
or
request.security_lower_tf()
calls, one effective way to optimize such requests is to condense them
into a single request.*() call that uses a
tuple as its expression argument. This optimization not only
helps improve the runtime of the requests; it also helps reduce the
script’s memory usage and compiled size.
As a simple example, the following script requests nine ta.percentrank() values with different lengths from a specified symbol using nine separate calls to request.security(). It then plots all nine requested values on the chart to utilize them in the outputs:
The results from profiling the script show that it took the script 340.8 milliseconds to complete its requests and plot the values in this run:
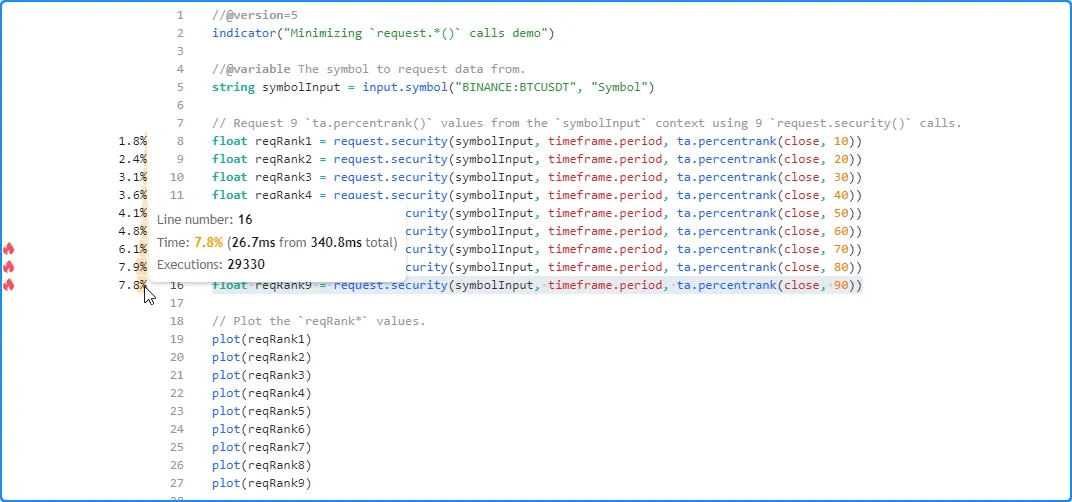
Since all the
request.security()
calls request data from the same context, we can optimize the
code’s resource usage by merging all of them into a single
request.security()
call that uses a
tuple as its expression argument:
As we see below, the profiled results from running this version of the script show that it took 228.3 milliseconds this time, a decent improvement over the previous run:
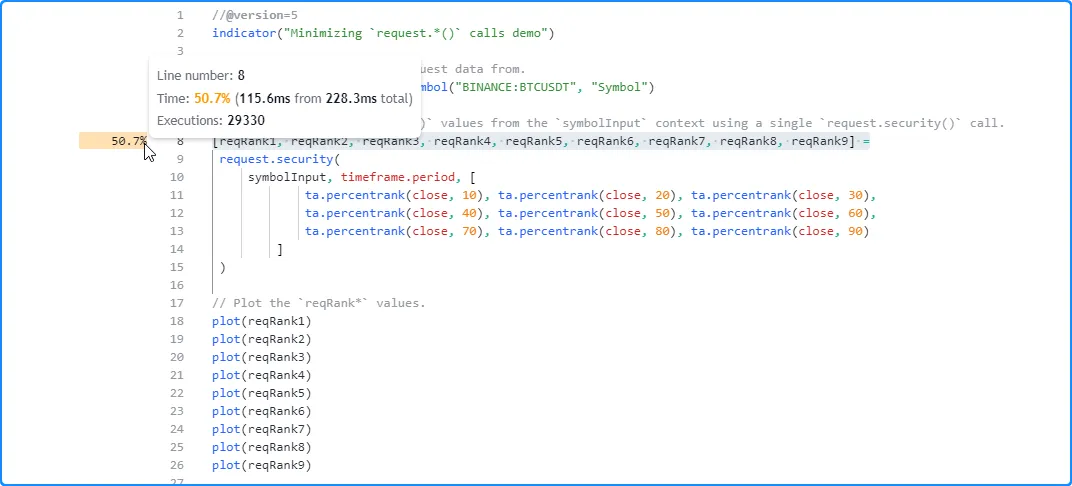
Note that:
- The computational resources available to a script fluctuate over time. As such, it’s typically a good idea to profile a script multiple times to help solidify performance conclusions.
- Another way to request multiple values from the same context
with a single
request.*()call is to pass an object of a user-defined type (UDT) as theexpressionargument. See this section of the Other timeframes and data page to learn more about requesting UDTs. - Programmers can also reduce the total runtime of a
request.security(),
request.security_lower_tf(),
or
request.seed()
call by passing an argument to the function’s
calc_bars_countparameter, which restricts the number of historical data points it can access from a context and execute required calculations on. In general, if calls to theserequest.*()functions retrieve more historical data than what a script needs, limiting the requests withcalc_bars_countcan help improve the script’s performance.
Avoiding redrawing
Pine Script’s drawing types allow scripts to draw custom visuals on a chart that one cannot achieve through other outputs such as plots. While these types provide greater visual flexibility, they also have a higher runtime and memory cost, especially when a script unnecessarily recreates drawings instead of directly updating their properties to change their appearance.
Most drawing types, excluding polylines, feature built-in setter functions in their namespaces that allow scripts to modify a drawing without deleting and recreating it. Utilizing these setters is typically less computationally expensive than creating a new drawing object when only specific properties require modification.
For example, the script below compares deleting and redrawing
boxes to using
box.set*() functions. On the first bar, it declares the redrawnBoxes
and updatedBoxes arrays
and executes a loop to push
25 box
elements into them.
The script uses a separate
for loop
to iterate across the arrays and update the drawings on each execution. It recreates
the boxes in
the redrawnBoxes array using
box.delete()
and
box.new(),
whereas it directly modifies the properties of the
boxes in the
updatedBoxes array using
box.set_lefttop()
and
box.set_rightbottom().
Both approaches achieve the same visual result. However, the latter is
more efficient:
The results from profiling this script show that line 24, which contains the box.new() call, is the heaviest line in the code block that executes on each bar, with a runtime close to double the combined time spent on the box.set_lefttop() and box.set_rightbottom() calls on lines 27 and 28:
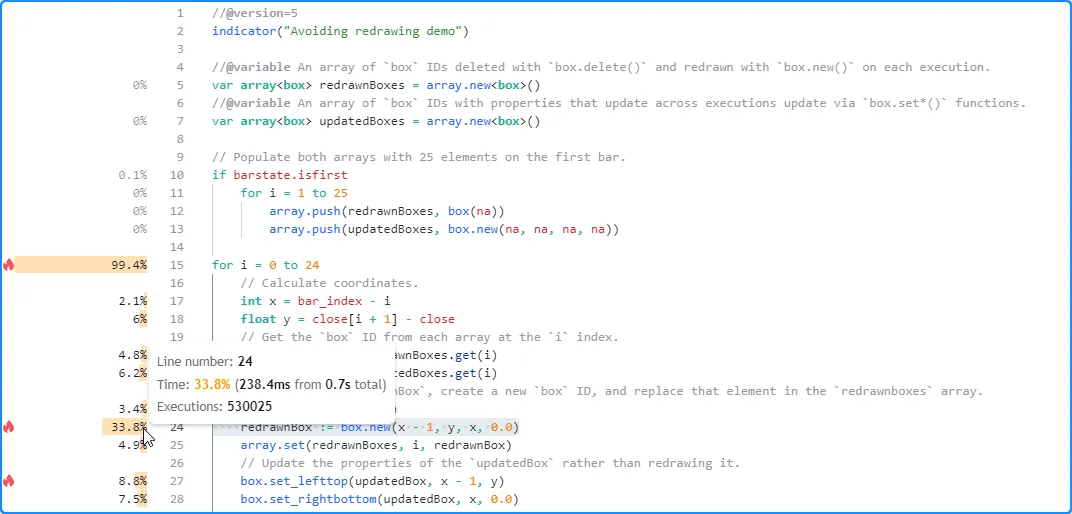
Note that:
- The number of executions shown for the loop’s local code is 25 times the number shown for the code in the script’s global scope, as each execution of the loop statement triggers 25 executions of the local block.
- This script updates its drawings over all bars in the chart’s history for testing purposes. However, it does not actually need to execute all these historical updates since users will only see the final result from the last historical bar and the changes across realtime bars. See the next section to learn more.
Reducing drawing updates
When a script produces drawing objects that change across historical bars, users will only ever see their final results on those bars since the script completes its historical executions when it first loads on the chart. The only time one will see such drawings evolve across executions is during realtime bars, as new data flows in.
Since the evolving outputs from dynamic drawings on historical bars are never visible to a user, one can often improve a script’s performance by eliminating the historical updates that don’t impact the final results.
For example, this script creates a
table
with two columns and 21 rows to visualize the history of an
RSI
in a paginated, tabular format. The script initializes the cells of the
infoTable on the first bar,
and it references the history of the calculated rsi to update the
text and bgcolor of the cells in the second column within a
for loop
on each bar:
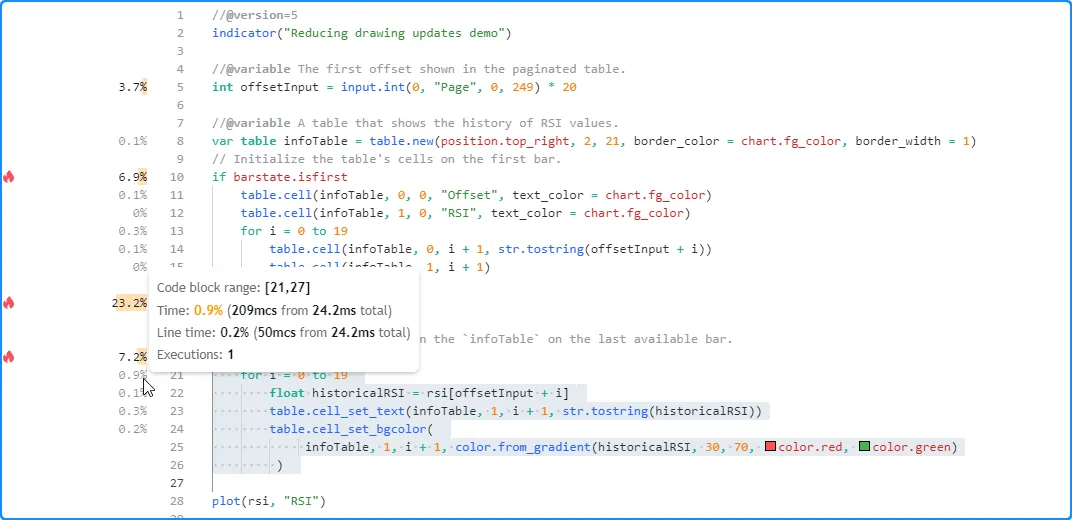
After profiling the script, we see that the code with the highest impact on performance is the for loop that starts on line 20, i.e., the code block that updates the table’s cells:
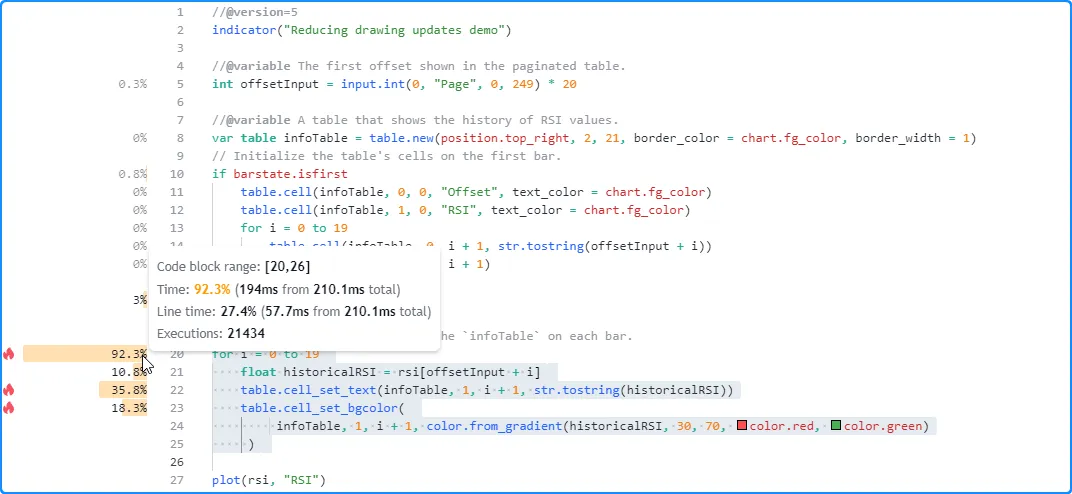
This critical code region executes excessively across the chart’s history, as users will only see the table’s final historical result. The only time that users will see the table update is on the last historical bar and across all subsequent realtime bars. Therefore, we can optimize this script’s resource usage by restricting the executions of this code to only the last available bar.
In this script version, we placed the loop that updates the table cells within an if structure that uses barstate.islast as its condition, effectively restricting the code block’s executions to only the last historical bar and all realtime bars. Now, the script loads more efficiently since all the table’s calculations only require one historical execution:
Note that:
- The script will still update the cells when new realtime updates come in, as users can observe those changes on the chart, unlike the changes that the script used to execute across historical bars.
Storing calculated values
When a script performs a critical calculation that changes infrequently throughout all executions, one can reduce its runtime by saving the result to a variable declared with the var or varip keywords and only updating the value if the calculation changes. If the script calculates multiple values excessively, one can store them within collections, matrices, and maps or objects of user-defined types.
Let’s look at an example. This script calculates a weighted moving
average with custom weights based on a generalized window
function. The
numerator is the sum of weighted
close
values, and the denominator is the sum of the calculated weights. The
script uses a
for loop
that iterates lengthInput times to calculate these sums, then it plots
their ratio, i.e., the resulting average:
After profiling the script’s performance over our chart’s data, we see that it took about 241.3 milliseconds to calculate the default 50-bar average across 20,155 chart updates, and the critical code with the highest impact on the script’s performance is the loop block that starts on line 17:
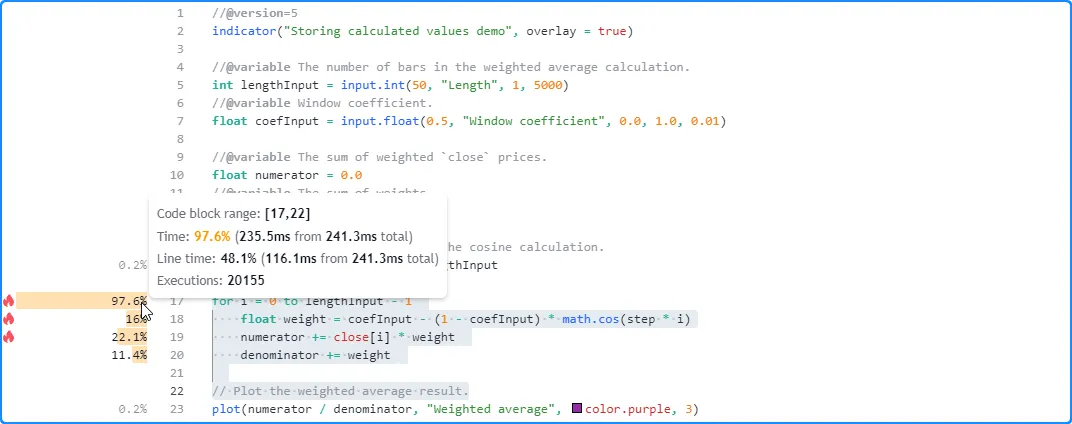
Since the number of loop iterations depends on the lengthInput
value, let’s test how its runtime scales with
another configuration requiring heavier looping. Here, we set the value to 2500.
This time, the script took about 12 seconds to complete all of its
executions:
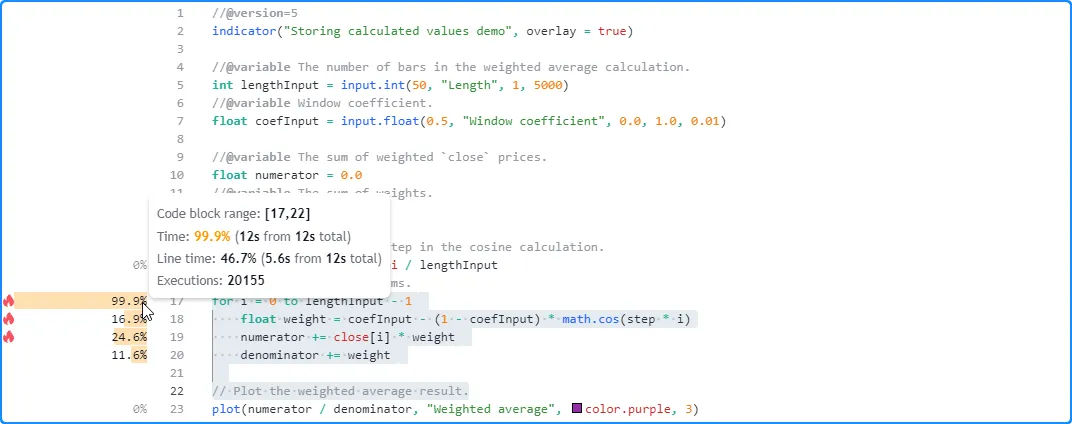
Now that we’ve pinpointed the script’s high-impact code and established a benchmark to improve, we can inspect the critical code block to identify optimization opportunities. After examining the calculations, we can observe the following:
- The only value that causes the
weightcalculation on line 18 to vary across loop iterations is the loop index. All other values in its calculation remain consistent. Consequently, theweightcalculated on each loop iteration does not vary across chart bars. Therefore, rather than calculating the weights on every update, we can calculate them once, on the first bar, and store them in a collection for future access across subsequent script executions. - Since the weights never change, the resulting
denominatornever changes. Therefore, we can add the var keyword to the variable declaration and only calculate its value once to reduce the number of executed addition assignment (+=) operations. - Unlike the
denominator, we cannot store thenumeratorvalue to simplify its calculation since it consistently changes over time.
In the modified script below, we’ve added a weights variable to
reference an
array
that stores each calculated weight. This variable and the
denominator both include the
var
keyword in their declarations, meaning the values assigned to them will
persist throughout all script executions until explicitly reassigned.
The script calculates their values using a
for loop
that executes only on the first chart bar.
Across all other bars, it calculates the numerator using a
for…in
loop that references the saved values from the weights array:
With this optimized structure, the
profiled results show that our modified script with a high lengthInput
value of 2500 took about 5.9 seconds to calculate across the same data,
about half the time of our previous version:
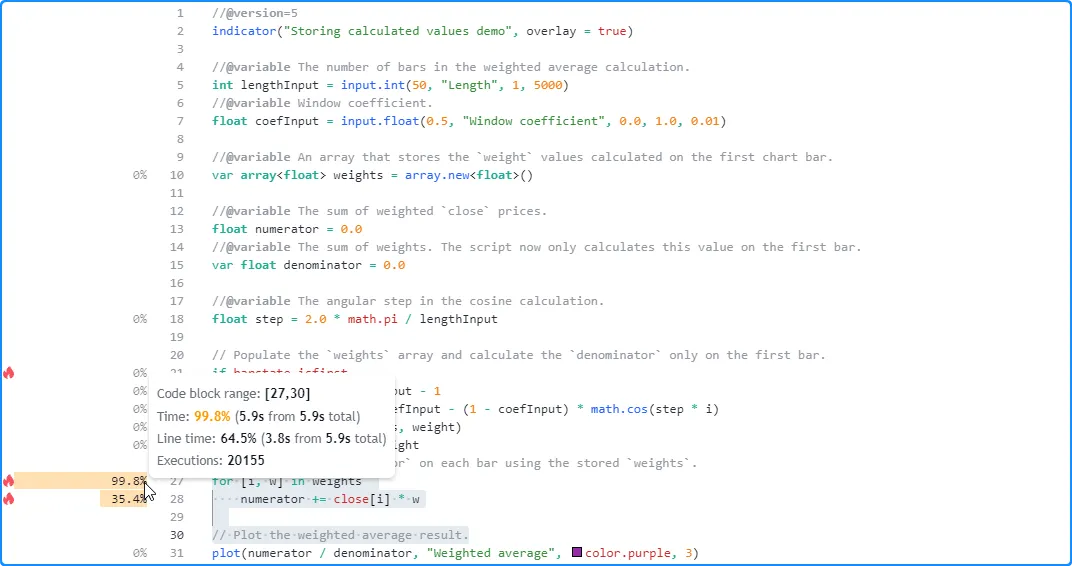
Note that:
- Although we’ve significantly improved this script’s
performance by saving its execution-invariant values to
variables, it does still involve a higher computational cost
with large
lengthInputvalues due to the remaining loop calculations that execute on each bar. - Another, more advanced way one can further enhance this
script’s performance is by storing the weights in a
single-row
matrix
on the first bar, using an
array
as a
queue to hold recent
close
values, then replacing the
for…in
loop with a call to
matrix.mult().
See the Matrices
page to learn more about working with
matrix.*()functions.
Eliminating loops
Loops allow Pine scripts to perform iterative calculations on each execution. Each time a loop activates, its local code may execute several times, often leading to a substantial increase in resource usage.
Pine loops are necessary for some calculations, such as manipulating elements within collections or looking backward through a dataset’s history to calculate values only obtainable on the current bar. However, in many other cases, programmers use loops when they don’t need to, leading to suboptimal runtime performance. In such cases, one may eliminate unnecessary loops in any of the following ways, depending on what their calculations entail:
- Identifying simplified, loop-free expressions that achieve the same result without iteration
- Replacing a loop with optimized built-ins where possible
- Distributing a loop’s iterations across bars when feasible rather than evaluating them all at once
This simple example contains an avgDifference() function that
calculates the average difference between the current bar’s source
value and all the values from length previous bars. The script calls
this function to calculate the average difference between the current
close
price and lengthInput previous prices, then it
plots the result on the
chart:
After inspecting the script’s profiled results with the default settings, we see that it took about 64 milliseconds to execute 20,157 times:

Since we use the lengthInput as the length argument in the
avgDifference() call and that argument controls how many times the
loop inside the function must iterate, our script’s runtime will
grow with the lengthInput value. Here, we set the input’s value
to 2000 in the script’s settings. This time, the script completed its
executions in about 3.8 seconds:

As we see from these results, the avgDifference() function can be
costly to call, depending on the specified lengthInput value, due to
its for
loop that executes on each bar. However,
loops are not necessary
to achieve the output. To understand why, let’s take a closer look at
the loop’s calculations. We can represent them with the following
expression:
Notice that it adds the current source value length times. These
iterative additions are not necessary. We can simplify that part of the
expression to source * length, which reduces it to the following:
or equivalently:
After simplifying and rearranging this representation of the loop’s
calculations, we see that we can compute the result in a simpler way and
eliminate the loop by subtracting the previous bar’s rolling sum (math.sum())
of source values from the source * length value, i.e.:
The fastAvgDifference() function below is a loop-free alternative
to the original avgDifference() function that uses the above
expression to calculate the sum of source differences, then divides
the expression by the length to return the average difference:
Now that we’ve identified a potential optimized solution, we can
compare the performance of fastAvgDifference() to the original
avgDifference() function. The script below is a modified form of the
previous version that plots the results from calling both functions with
the lengthInput as the length argument:
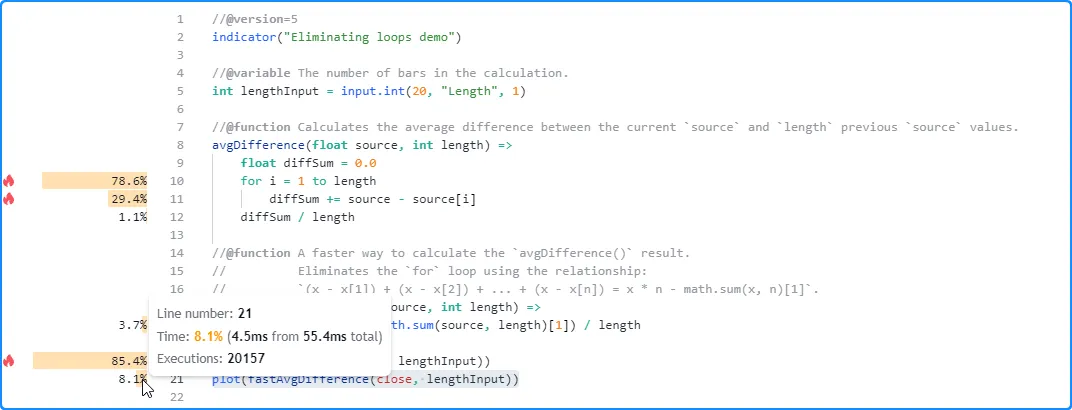
The
profiled results for the script with the default lengthInput of 20 show a
substantial difference in runtime spent on the two function calls. The
call to the original function took about 47.3 milliseconds to execute
20,157 times on this run, whereas our optimized function only took 4.5
milliseconds:
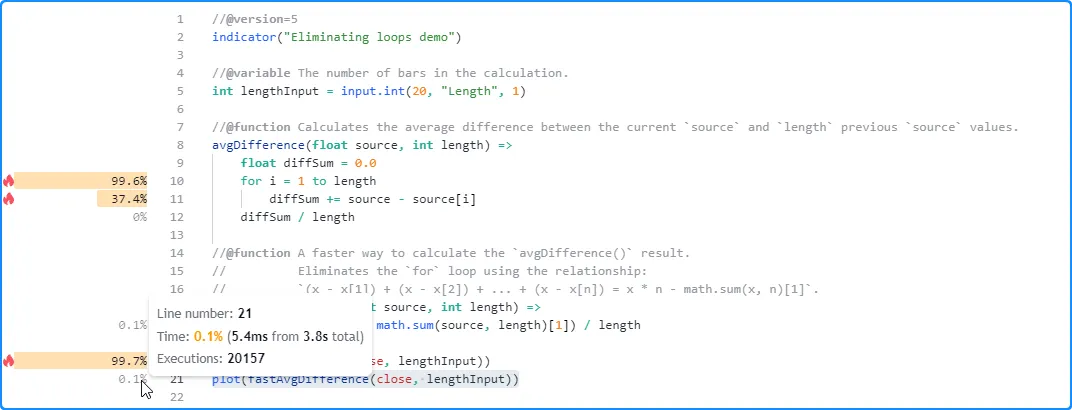
Now, let’s compare the performance with the heavier lengthInput
value of 2000. As before, the runtime spent on the avgDifference()
function increased significantly. However, the time spent executing the
fastAvgDifference() call remained very close to the result from the
previous
configuration. In other words, while our original function’s runtime
scales directly with its length argument, our optimized function
demonstrates relatively consistent performance since it does not
require a loop:
Optimizing loops
Although Pine’s execution model and the available built-ins often eliminate the need for loops in many cases, there are still instances where a script will require loops for some types of tasks, including:
- Manipulating collections or executing calculations over a collection’s elements when the available built-ins will not suffice
- Performing calculations across historical bars that one cannot achieve with simplified loop-free expressions or optimized built-ins
- Calculating values that are only obtainable through iteration
When a script uses loops that a programmer cannot eliminate, there are several techniques one can use to reduce their performance impact. This section explains two of the most common, useful techniques that can help improve a required loop’s efficiency.
Reducing loop calculations
The code executed within a loop’s local scope can have a multiplicative impact on its overall runtime, as each time a loop statement executes, it will typically trigger several iterations of the local code. Therefore, programmers should strive to keep a loop’s calculations as simple as possible by eliminating unnecessary structures, function calls, and operations to minimize the performance impact, especially when the script must evaluate its loops numerous times throughout all its executions.
For example, this script contains a filteredMA() function that
calculates a moving average of up to length unique source values,
depending on the true elements in a specified mask
array.
The function queues the unique source values into a data
array,
uses a
for…in
loop to iterate over the data and calculate the numerator and
denominator sums, then returns the ratio of those sums. Within the
loop, it only adds values to the sums when the data element is not
na and
the mask element at the index is true. The script utilizes this
user-defined function to calculate the average of up to 100 unique
close
prices filtered by a randMask and plots the result on the chart:
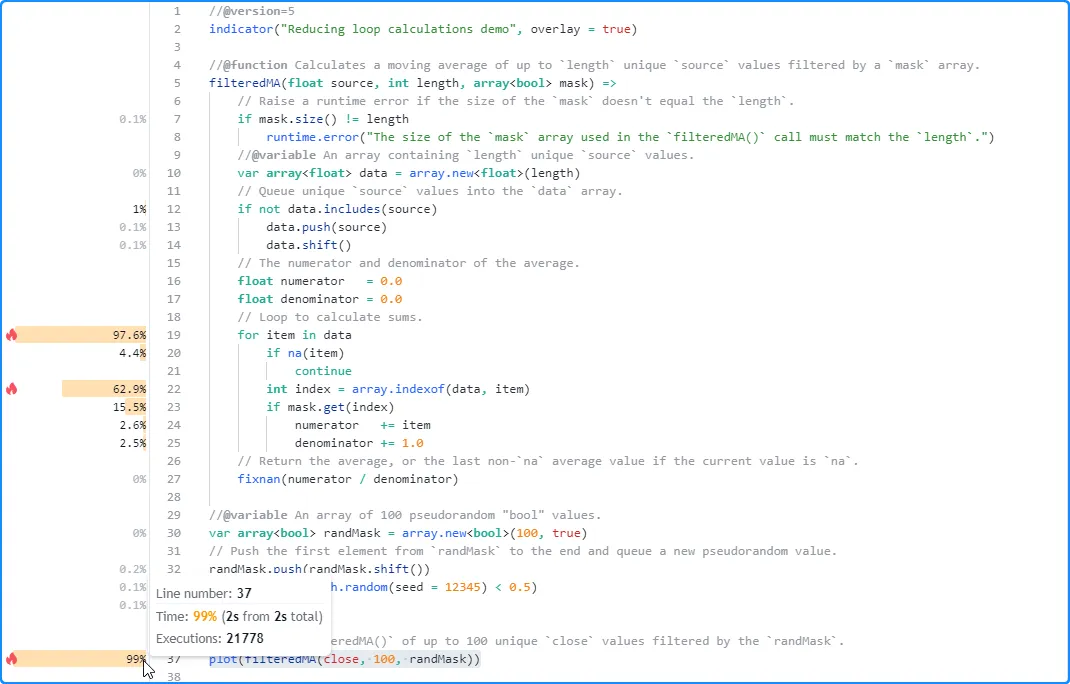
After
profiling the script, we see it took about two seconds to execute 21,778 times.
The code with the highest performance impact is the expression on line
37, which calls the filteredMA() function. Within the filteredMA()
function’s scope, the
for…in
loop has the highest impact, with the index calculation in the loop’s
scope (line 22) contributing the most to the loop’s runtime:
The above code demonstrates suboptimal usage of a
for…in
loop, as we do not need to call
array.indexof()
to retrieve the index in this case. The
array.indexof()
function can be costly to call within a loop since it must search
through the array’s
contents and locate the corresponding element’s index each time the
script calls it.
To eliminate this costly call from our for…in loop, we can use the second form of the structure, which produces a tuple containing the index and the element’s value on each iteration:
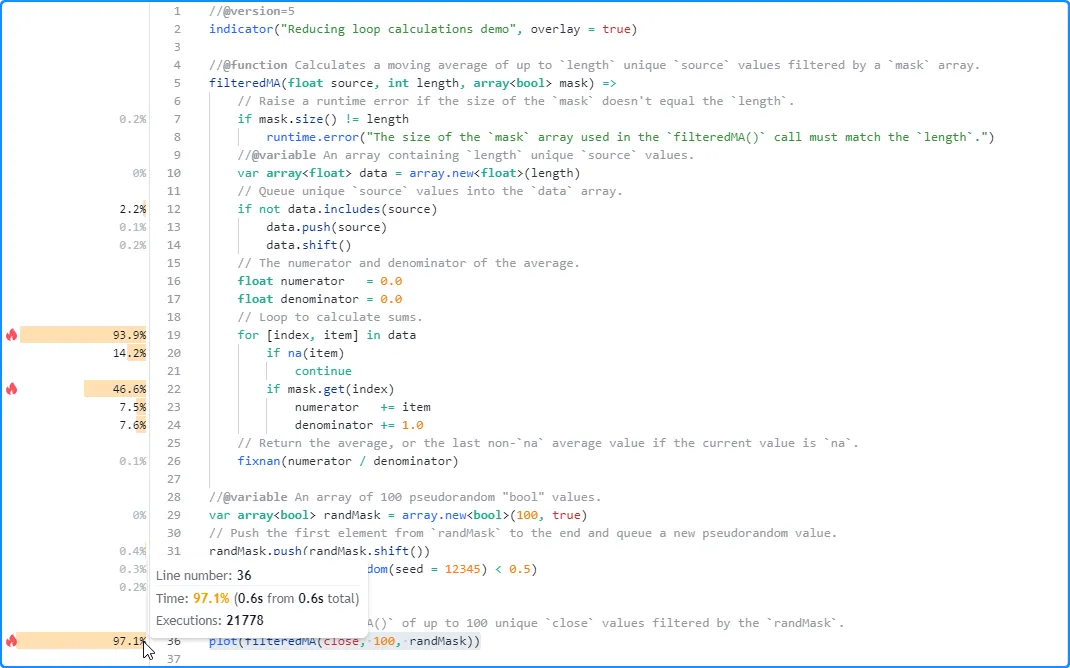
In this version of the script, we removed the array.indexof() call on line 22 since it is not necessary to achieve the intended result, and we changed the for…in loop to use the alternative form:
With this simple change, our loop is much more efficient, as it no longer needs to redundantly search through the array on each iteration to keep track of the index. The profiled results from this script run show that it took only 0.6 seconds to complete its executions, a significant improvement over the previous version’s result:
Loop-invariant code motion
Loop-invariant code is any code region within a loop’s scope that produces an unchanging result on each iteration. When a script’s loops contain loop-invariant code, it can substantially impact performance in some cases due to excessive, unnecessary calculations.
Programmers can optimize a loop with invariant code by moving the unchanging calculations outside the loop’s scope so the script only needs to evaluate them once per execution rather than repetitively.
The following example contains a featureScale() function that creates
a rescaled version of an
array.
Within the function’s
for…in
loop, it scales each element by calculating its distance from the
array.min()
and dividing the value by the
array.range().
The script uses this function to create a rescaled version of a
prices array, then plots the
difference between the array’s
array.first()
and
array.avg()
method call results on the chart:
As we see below, the
profiled results for this script after 20,187 executions show it completed
its run in about 3.3 seconds. The code with the highest impact on
performance is the line containing the featureScale() function call,
and the function’s critical code is the
for…in
loop block starting on line 7:
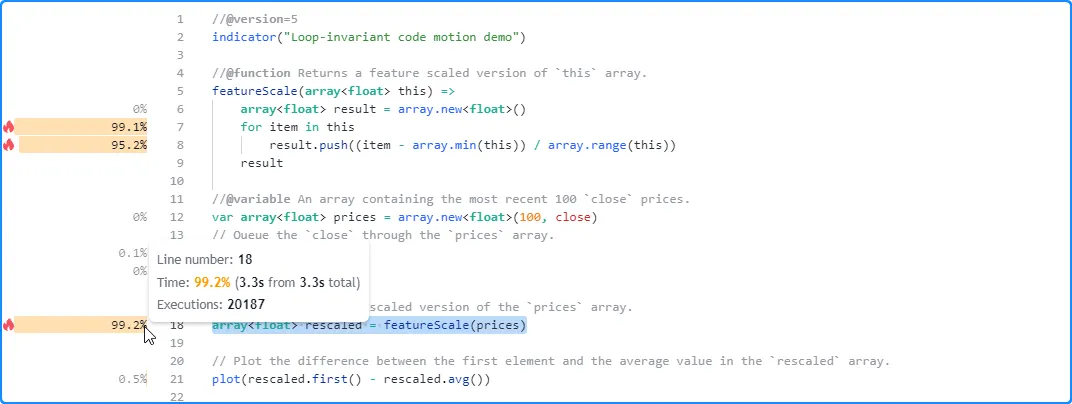
Upon examining the loop’s calculations, we can see that the array.min() and array.range() calls on line 8 are loop-invariant, as they will always produce the same result across each iteration. We can make our loop much more efficient by assigning the results from these calls to variables outside its scope and referencing them as needed.
The featureScale() function in the script below assigns the
array.min()
and
array.range()
values to minValue and rangeValue variables before executing the
for…in
loop. Inside the loop’s local scope, it references the variables
across its iterations rather than repetitively calling these array.*()
functions:
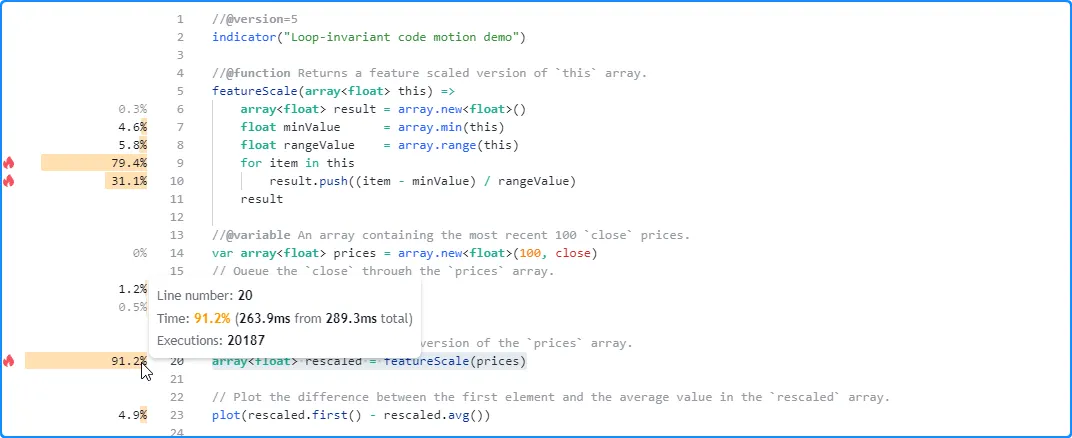
As we see from the script’s profiled results, moving the loop-invariant calculations outside the loop leads to a substantial performance improvement. This time, the script completed its executions in only 289.3 milliseconds:
Minimizing historical buffer calculations
Pine scripts create historical buffers for all variables and function calls their outputs depend on. Each buffer contains information about the range of historical values the script can access with the history-referencing operator [].
A script automatically determines the required buffer size for all its variables and function calls by analyzing the historical references executed during the first 244 bars in a dataset. When a script only references the history of a calculated value after those initial bars, it will restart its executions repetitively across previous bars with successively larger historical buffers until it either determines the appropriate size or raises a runtime error. Those repetitive executions can significantly increase a script’s runtime in some cases.
When a script excessively executes across a dataset to calculate historical buffers, one effective way to improve its performance is explicitly defining suitable buffer sizes using the max_bars_back() function. With appropriate buffer sizes declared explicitly, the script does not need to re-execute across past data to determine the sizes.
For example, the script below uses a
polyline
to draw a basic histogram representing the distribution of calculated
source values over 500 bars. On the last available
bar,
the script uses a
for loop
to look back through historical values of the calculated source series
and determine the
chart points used by the
polyline
drawing. It also plots the
value of bar_index + 1 to verify the number of bars it executed
across:
Since the script only references past source values on the last
bar, it will not construct a suitable historical buffer for the
series within the first 244 bars on a larger dataset. Consequently, it
will re-execute across all historical bars to identify the
appropriate buffer size.
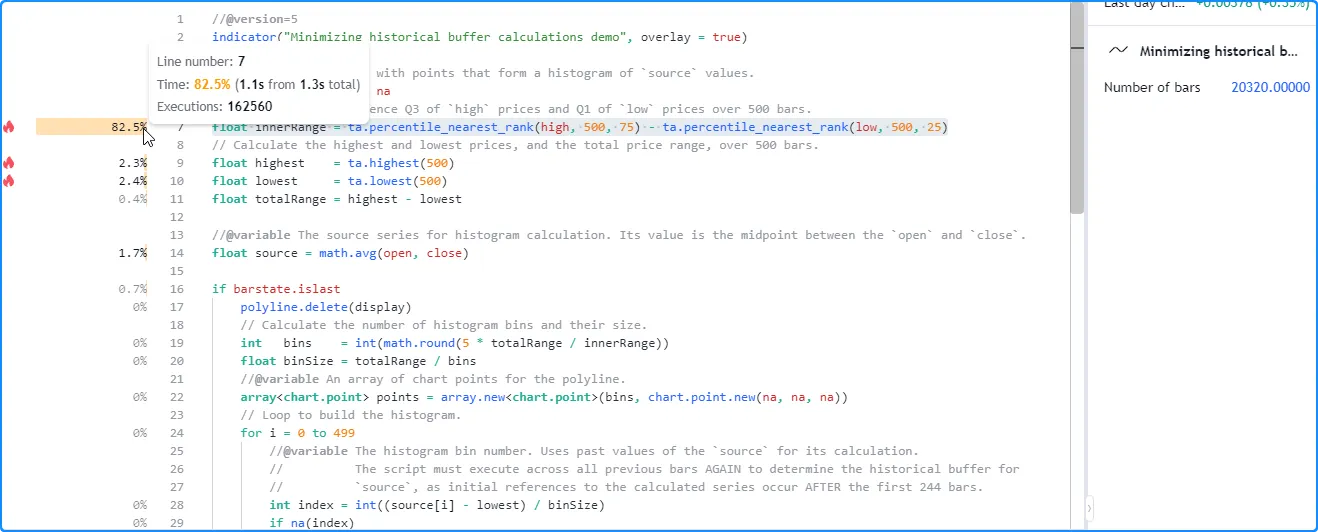
As we see from the
profiled results after running the script across 20,320 bars, the number of
global code executions was 162,560, which is eight times the
number of chart bars. In other words, the script had to repeat the
historical executions seven more times to determine the appropriate
buffer for the source series in this case:
This script will only reference the most recent 500 source values on
the last historical bar and all realtime bars. Therefore, we can help it
establish the correct buffer without re-execution by defining a
500-bar referencing length with
max_bars_back().
In the following script version, we added max_bars_back(source,
500)
after the variable declaration to explicitly specify that the script
will access up to 500 historical source values throughout its
executions:
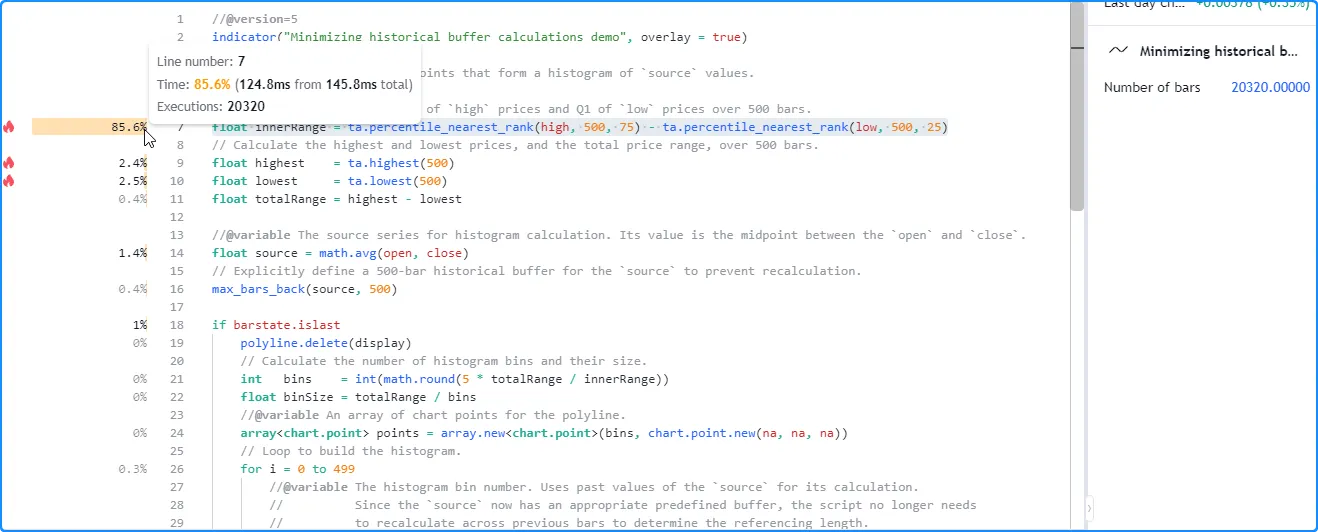
With this change, our script no longer needs to re-execute across all the historical data to determine the buffer size. As we see in the profiled results below, the number of global code executions now aligns with the number of chart bars, and the script took substantially less time to complete all of its historical executions:
Note that:
- This script only requires up to the most recent 501 historical
bars to calculate its drawing output. In this case, another way
to optimize resource usage is to include
calc_bars_count = 501in the indicator() function, which reduces unnecessary script executions by restricting the historical data the script can calculate across to 501 bars.
Tips
Working around Profiler overhead
Since the Pine Profiler must perform extra calculations to collect performance data, as explained in this section, the time it takes to execute a script increases while profiling.
Most scripts will run as expected with the Profiler’s overhead included. However, when a complex script’s runtime approaches a plan’s limit, using the Profiler on it may cause its runtime to exceed the limit. Such a case indicates that the script likely needs optimization, but it can be challenging to know where to start without being able to profile the code. The most effective workaround in this scenario is reducing the number of bars the script must execute on. Users can achieve this reduction in any of the following ways:
- Selecting a dataset that has fewer data points in its history, e.g., a higher timeframe or a symbol with limited data
- Using conditional logic to limit code executions to a specific time or bar range
- Including a
calc_bars_countargument in the script’s declaration statement to specify how many recent historical bars it can use
Reducing the number of data points works in most cases because it directly decreases the number of times the script must execute, typically resulting in less accumulated runtime.
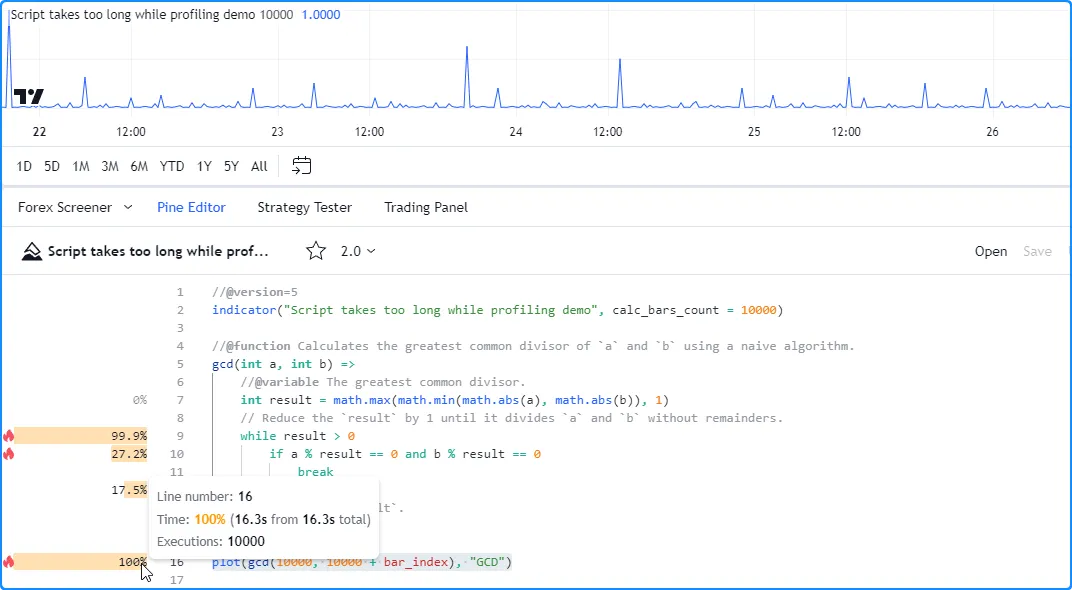
As a demonstration, this script contains a gcd() function that uses a
naive algorithm to calculate the greatest common
divisor of two
integers. The function initializes its result using the smallest
absolute value of the two numbers. Then, it reduces the value of the
result by one within a
while
loop until it can divide both numbers without remainders. This structure
entails that the loop will iterate up to N times, where N is the
smallest of the two arguments.
In this example, the script plots the value of
gcd(10000, 10000 + bar_index). The smallest of the two arguments is
always 10,000 in this case, meaning the
while
loop within the function will require up to 10,000 iterations per script
execution, depending on the
bar_index
value:
When we add the script to our chart, it takes a while to execute across our chart’s data, but it does not raise an error. However, after enabling the Profiler, the script raises a runtime error stating that it exceeded the Premium plan’s runtime limit (40 seconds):
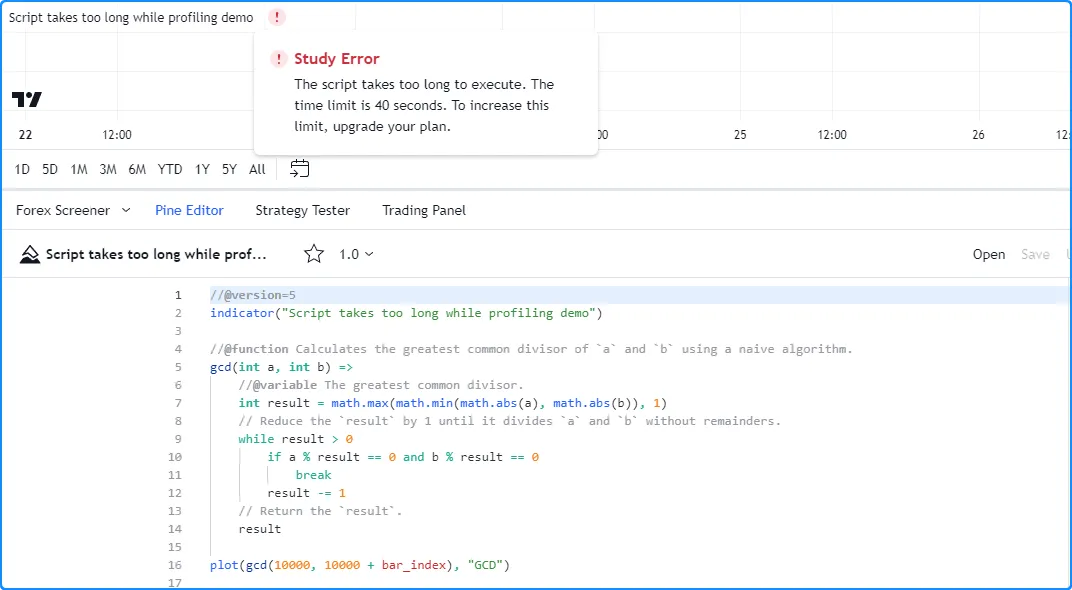
Our current chart has over 20,000 historical bars, which may be too many for the script to handle within the alloted time while the Profiler is active. We can try limiting the number of historical executions to work around the issue in this case.
Below, we included calc_bars_count = 10000 in the
indicator()
function, which limits the script’s available history to the most
recent 10,000 historical bars. After restricting the script’s
historical executions, it no longer exceeds the Premium plan’s limit
while profiling, so we can now inspect its performance results:
