OPEN-SOURCE SCRIPT
Aggiornato EMA 50 & 200 (TF-specific)
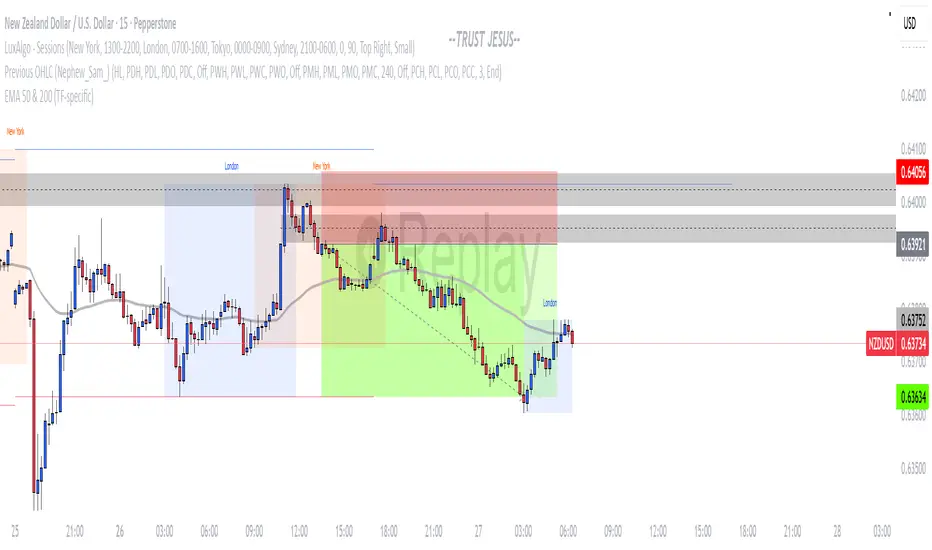
This script plots EMA 50 and EMA 200 only on the timeframes where they matter most:
EMA 50 (gray): visible on 1H, 4H, and 12H charts – often used by intraday traders.
EMA 200 (black): visible on Daily and Weekly charts – a classic long-term trend indicator.
🔹 Why use it?
Avoids clutter by showing each EMA only on the relevant timeframe.
Helps align intraday trading with higher timeframe trends.
Simple, clean, and effective for both swing and day trading.
Note di rilascio
This script plots EMA 50 and EMA 200 only on the timeframes where they matter most:EMA 50 (gray): visible on 5m, 15m, 30m, 1H, 4H, and 12H charts – often used by intraday traders.
EMA 200 (black): visible on Daily and Weekly charts – a classic long-term trend indicator.
🔹 Why use it?
Avoids clutter by showing each EMA only on the relevant timeframe.
Helps align intraday trading with higher timeframe trends.
Simple, clean, and effective for both swing and day trading.
Script open-source
In pieno spirito TradingView, il creatore di questo script lo ha reso open-source, in modo che i trader possano esaminarlo e verificarne la funzionalità. Complimenti all'autore! Sebbene sia possibile utilizzarlo gratuitamente, ricorda che la ripubblicazione del codice è soggetta al nostro Regolamento.
Declinazione di responsabilità
Le informazioni ed i contenuti pubblicati non costituiscono in alcun modo una sollecitazione ad investire o ad operare nei mercati finanziari. Non sono inoltre fornite o supportate da TradingView. Maggiori dettagli nelle Condizioni d'uso.