OPEN-SOURCE SCRIPT
Aggiornato Kalman Filter Volume Bands by Tenozen
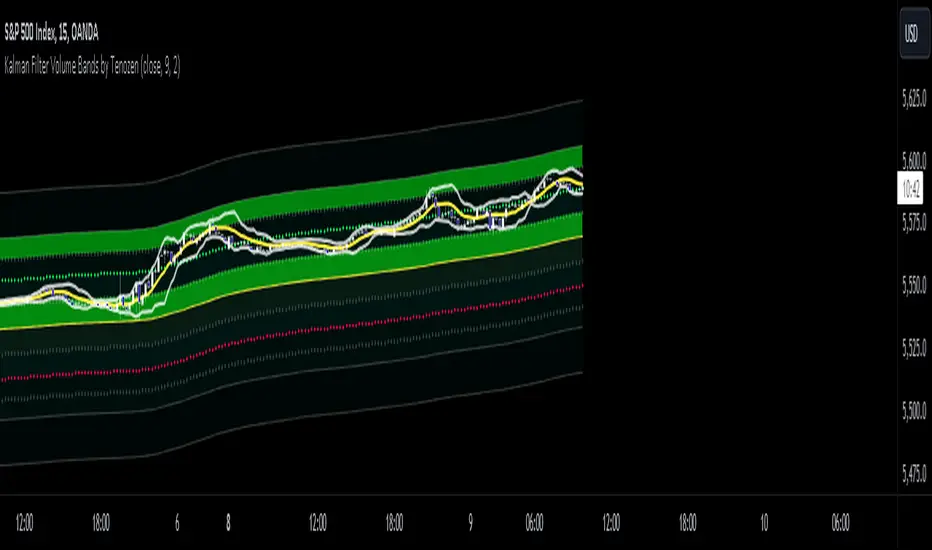
Hello there! I am excited to introduce a new original indicator, the Kalman Filter Volume Bands. This indicator is calculated using the Kalman Filter, which is an adaptive-based smoothing quantitative tool. The Kalman Filter Volume Bands have two components that support the calculation, namely VWAP and VaR.
VWAP is used to determine the weight of the Kalman Filter Returns, but it doesn't have a significant impact on the calculation. On the other hand, VaR or Value at risk is calculated using the 99th percentile, which means that there is a 1% chance for the returns to exceed the 99th percentile level. After getting the VaR value, I manually adjust the bands based on the current market I'm trading on. I take the highest point (VaR*2) and the lowest point (-(VaR*2)) from the Kalman Filter, and then divide them into segments manually based on my preference.
This process results in 8 segments, where 2 segments near the Kalman Filter are further divided, making a total of 12 segments. These segments classify the current state of the price based on code-based coloring. The five states are very bullish, bullish, very bearish, bearish, and neutral.
I created this indicator to have an adaptive band that is not biased toward the volatility of the market. Most band-based indicators don't capture reversals that well, but the Kalman Filter Volume Bands can capture both trends and reversals. This makes it suitable for both trend-following and reversal trading approaches.
That's all for the explanation! Ciao!
Additional Reminder:
- Please use hourly timeframes or higher as lower timeframes are too noisy for reliable readings of this indicator.
Note di rilascio
Added Kalman Average and BandsScript open-source
Nello spirito di TradingView, l'autore di questo script lo ha reso open source, in modo che i trader possano esaminarne e verificarne la funzionalità. Complimenti all'autore! Sebbene sia possibile utilizzarlo gratuitamente, ricordiamo che la ripubblicazione del codice è soggetta al nostro Regolamento.
Declinazione di responsabilità
Le informazioni e le pubblicazioni non sono intese come, e non costituiscono, consulenza o raccomandazioni finanziarie, di investimento, di trading o di altro tipo fornite o approvate da TradingView. Per ulteriori informazioni, consultare i Termini di utilizzo.
Script open-source
Nello spirito di TradingView, l'autore di questo script lo ha reso open source, in modo che i trader possano esaminarne e verificarne la funzionalità. Complimenti all'autore! Sebbene sia possibile utilizzarlo gratuitamente, ricordiamo che la ripubblicazione del codice è soggetta al nostro Regolamento.
Declinazione di responsabilità
Le informazioni e le pubblicazioni non sono intese come, e non costituiscono, consulenza o raccomandazioni finanziarie, di investimento, di trading o di altro tipo fornite o approvate da TradingView. Per ulteriori informazioni, consultare i Termini di utilizzo.