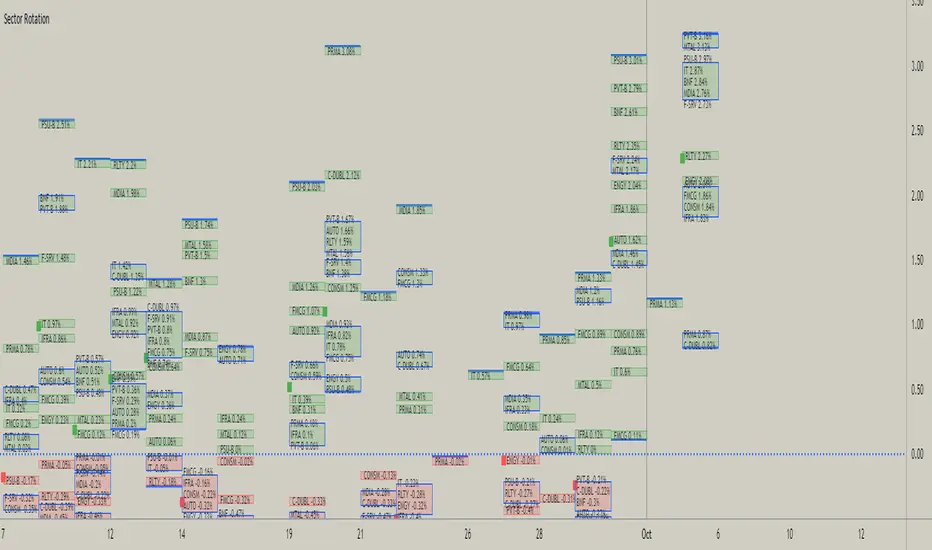
This script is attempt to create and observe the real-time and historical performance of the all major sectors of Indian Market in one screen.
for Data Presentation I used Short sector names so that I can manage to get space and efficient presentable data.
Short Names and Actual Sector Names

In this Update following features are added
for Data Presentation I used Short sector names so that I can manage to get space and efficient presentable data.
Short Names and Actual Sector Names
- BNF : CNX-BANKNIFTY
- IT : CNX-IT
- PRMA : CNX - PHARMA
- FMCG : CNX-FMCG
- AUTO : CNX-AUTO
- MTAL : CNX-METAL
- MDIA : CNX-MEDIA
- RLTY : CNX-REALTY
- IFRA : CNX-INFRA
- ENGY : CNX-ENERGY
- PSU-B : CNX-PSU-BANK
- PVT-B : NIFTY-PVT-BANK
- F-SRV : CNX-FINANCE
- CONSM : CNX-CONSUMPTION
- C-DUBL : NIFTY_CONSR_DURBL
- You can use this script in 30-min, Daily, Weekly and Monthly Time Frames.
- The green Square denotes the current Symbol Performance.
- The Blue Border boxes are created when one sector intersects other sector.
In this Update following features are added
- Now users have control over sectors, what are all the sectors you wanted to plot you can select from the input menu.
- Currently user can highlight any one sector in different border color so that user can easily spot and track particular sector.
- This thicker blue line denotes lowest and highest point of the current timeframe.
Script open-source
Nello spirito di TradingView, l'autore di questo script lo ha reso open source, in modo che i trader possano esaminarne e verificarne la funzionalità. Complimenti all'autore! Sebbene sia possibile utilizzarlo gratuitamente, ricordiamo che la ripubblicazione del codice è soggetta al nostro Regolamento.
Declinazione di responsabilità
Le informazioni e le pubblicazioni non sono intese come, e non costituiscono, consulenza o raccomandazioni finanziarie, di investimento, di trading o di altro tipo fornite o approvate da TradingView. Per ulteriori informazioni, consultare i Termini di utilizzo.