OPEN-SOURCE SCRIPT
Aggiornato Tickers Info Extension
With the indicator you can easily evaluate or compare any ticker with the one you choose in the options.
You can choose any of the tickers I provide in the mod options to your liking :
You can also select or create your own ticker if you select the Custom in Mode option.
If the Compare mode is enabled, then the current ticker you are viewing is divided by the ticker selected in the indicator (in the Mode option).
Thus, you create a new pair and can evaluate the strength of this or that asset.
For example, if you have the ticker BTCUSDT open. And the ticker XAU is selected in the Mode option in the indicator. And the Compare mode is also enabled. Then you will get a new BTCUSDT/XAU pair. That means that now you can see the bitcoin/gold ratio. (Same as EUR/USD etc.)
If the Compare option is switched off then you will see the usual ticker you choose in the Mode option. You can also see if there is a correlation between the selected pairs.
Option 'AVG STABLE.D' = Calculated as: USDT.D + USDC.D + DAI.D
- This is the average domination of the most important Stable Coins
Option 'AVG STOCK Price' = Calculated as: (DJI + SPX + NDQ) / 3
- This is the average price of the most important Indexes.
You can choose any of the tickers I provide in the mod options to your liking :
- XAU
- DXY
- BTC
- ETH
- SPX
- NASDAQ
- AVG Stable Dominance
- AVG Stock Price
- Custom
You can also select or create your own ticker if you select the Custom in Mode option.
If the Compare mode is enabled, then the current ticker you are viewing is divided by the ticker selected in the indicator (in the Mode option).
Thus, you create a new pair and can evaluate the strength of this or that asset.
For example, if you have the ticker BTCUSDT open. And the ticker XAU is selected in the Mode option in the indicator. And the Compare mode is also enabled. Then you will get a new BTCUSDT/XAU pair. That means that now you can see the bitcoin/gold ratio. (Same as EUR/USD etc.)
If the Compare option is switched off then you will see the usual ticker you choose in the Mode option. You can also see if there is a correlation between the selected pairs.
Option 'AVG STABLE.D' = Calculated as: USDT.D + USDC.D + DAI.D
- This is the average domination of the most important Stable Coins
Option 'AVG STOCK Price' = Calculated as: (DJI + SPX + NDQ) / 3
- This is the average price of the most important Indexes.
Note di rilascio
// Globale UpdateNote di rilascio
Added a built-in option to capitalize altcoins excluding ETH (TOTAL3).Added an option to choose "Logarithmic" and "Linear" chart type. The default is Logarithmic.
Added an option to view not only the candlestick chart but also a simple linetype depending on the source [OPEN, HIGH, LOW, CLOSE].
Ppolished up the code a little.
Note di rilascio
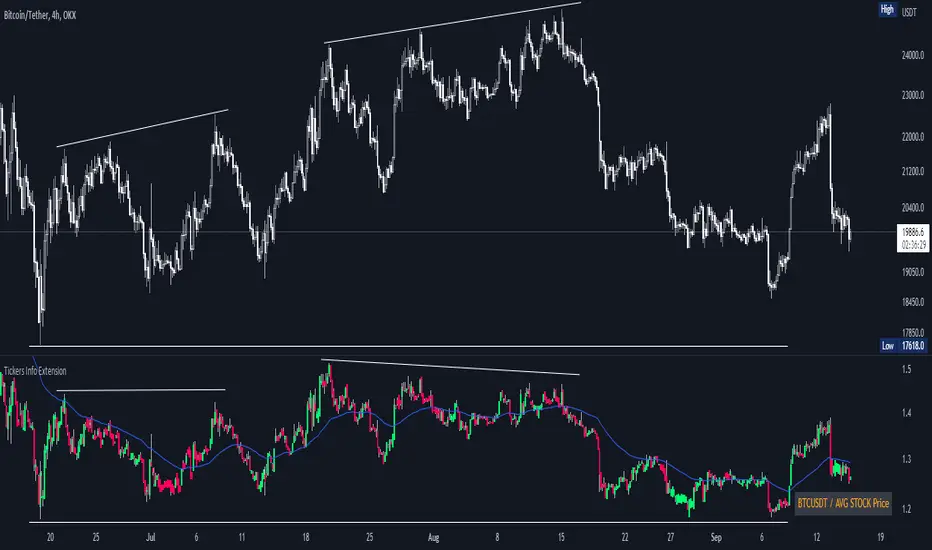
I also want to show an example from personal experience how you can use this indicator. I posted an idea where I compared BITCOIN and the average price of the stock market ((DJI + SPX + NDQ) / 3).Idea:

I immediately marked interesting levels and started waiting.
The result :
https://www.tradingview.com/x/TGh03xXv
Note di rilascio
Nothing global. I just updated the code to something simpler and more readable.Also recommend reading my new work "Aggregated Volume"
https://www.tradingview.com/script/T6dlVzTV-Aggregated-Volume-CVD-Liquidations-Delta/
Note di rilascio
Small fix for Type Symbol.Note di rilascio
- Code Refactor. The code became simpler and even more readable.
- Removed the ability to select the graph type "Logarithmic" and "Linear". The default is "Linear".
-(Removed due to logarithmic calculation errors on some graphs. Nothing critical, just sometimes the price was shown incorrectly.) - You can still manually select the type of chart by right-clicking on the scale of the indicator.
Script open-source
Nello spirito di TradingView, l'autore di questo script lo ha reso open source, in modo che i trader possano esaminarne e verificarne la funzionalità. Complimenti all'autore! Sebbene sia possibile utilizzarlo gratuitamente, ricordiamo che la ripubblicazione del codice è soggetta al nostro Regolamento.
Declinazione di responsabilità
Le informazioni e le pubblicazioni non sono intese come, e non costituiscono, consulenza o raccomandazioni finanziarie, di investimento, di trading o di altro tipo fornite o approvate da TradingView. Per ulteriori informazioni, consultare i Termini di utilizzo.