OPEN-SOURCE SCRIPT
Aggiornato RSI Trend Transform [wbburgin]
The RSI Trend Transform indicator is a dual-concept indicator that transforms volume data and price data into two different RSI values, which can then be used together to determine trend strength and momentum. The volume RSI does not use any price data in its calculation - it is purely a transform from nondirectional volume into a directional indicator.
The RSI for all three RSI values (price, volume,combined average) can be plotted as either stochastic or normal. The RSI calculation is adapted for use on volume, which is why the normal ta.rsi() function is not used for the price RSI calculation; both use the same formula for indicator consistency.
How to Use the Indicator
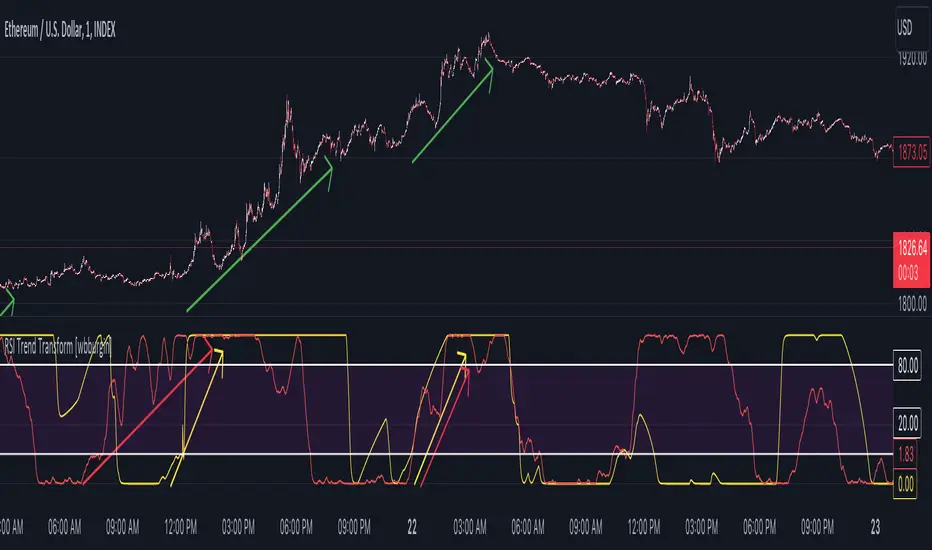
In the examples below, the Price RSI is plotted in yellow and the Volume RSI is plotted in red (length = 200, which is why the indicator is large in these examples). The indicator can be used on any timeframe and any asset, provided volume data is provided by the vendor to TradingView.
Identifying Bullish Trends
A rising volume RSI with a rising price RSI signifies a bullish trend. Example 1:
https://www.tradingview.com/x/FKi4D8fs/
Example 2:
https://www.tradingview.com/x/XYRegXEl/
You can use the combined RSI (the average of the volume RSI and the price RSI) to help with the identification of these trends: https://www.tradingview.com/x/1pnopCRb/
Identifying Bearish Trends
A falling volume RSI with a falling price RSI signifies a bearish trend:
https://www.tradingview.com/x/BuqBTpGo/
Example 2:
https://www.tradingview.com/x/oWvD2SlE/
Settings
Source is the source of the price RSI, the volume RSI will by default use volume in its calculations. If you have other indicators on-chart, you could even use the ATR, a volatility indicator, or any nondirectional or directional indicator and transform it into the "price" RSI.
Length is both the length of the RSI and the stochastic.
The next three rows are for each RSI you can plot on the indicator: price RSI, volume RSI, and combined RSI (average of price and volume). The first checkbox plots/removes them from the chart, you can subsequently choose the type of RSI (regular or stochastic), the color of the plot, and the length of the EMA smoothing applied afterward to the plot.
Upper Band and Lower Band refer to the overbought and oversold lines, respectively.
A note about the combined RSI- you will be unable to spot divergences if the combined RSI is the only plot on the indicator, so I encourage you to use the combined RSI as a way to confirm the overall trend if you notice the price RSI and the volume RSI and trending similarly.
The RSI for all three RSI values (price, volume,combined average) can be plotted as either stochastic or normal. The RSI calculation is adapted for use on volume, which is why the normal ta.rsi() function is not used for the price RSI calculation; both use the same formula for indicator consistency.
How to Use the Indicator
In the examples below, the Price RSI is plotted in yellow and the Volume RSI is plotted in red (length = 200, which is why the indicator is large in these examples). The indicator can be used on any timeframe and any asset, provided volume data is provided by the vendor to TradingView.
Identifying Bullish Trends
A rising volume RSI with a rising price RSI signifies a bullish trend. Example 1:
https://www.tradingview.com/x/FKi4D8fs/
Example 2:
https://www.tradingview.com/x/XYRegXEl/
You can use the combined RSI (the average of the volume RSI and the price RSI) to help with the identification of these trends: https://www.tradingview.com/x/1pnopCRb/
Identifying Bearish Trends
A falling volume RSI with a falling price RSI signifies a bearish trend:
https://www.tradingview.com/x/BuqBTpGo/
Example 2:
https://www.tradingview.com/x/oWvD2SlE/
Settings
Source is the source of the price RSI, the volume RSI will by default use volume in its calculations. If you have other indicators on-chart, you could even use the ATR, a volatility indicator, or any nondirectional or directional indicator and transform it into the "price" RSI.
Length is both the length of the RSI and the stochastic.
The next three rows are for each RSI you can plot on the indicator: price RSI, volume RSI, and combined RSI (average of price and volume). The first checkbox plots/removes them from the chart, you can subsequently choose the type of RSI (regular or stochastic), the color of the plot, and the length of the EMA smoothing applied afterward to the plot.
Upper Band and Lower Band refer to the overbought and oversold lines, respectively.
A note about the combined RSI- you will be unable to spot divergences if the combined RSI is the only plot on the indicator, so I encourage you to use the combined RSI as a way to confirm the overall trend if you notice the price RSI and the volume RSI and trending similarly.
Note di rilascio
Because combined was originally the square of price * volume, use in the stochastic meant that the value would fluctuate when one of the two sources was at 0. This was unideal so I changed it to the average, which will have a similar effect.Note di rilascio
The source was not directly inputted into the function, now the source is changeable as intended.Script open-source
Nello spirito di TradingView, l'autore di questo script lo ha reso open source, in modo che i trader possano esaminarne e verificarne la funzionalità. Complimenti all'autore! Sebbene sia possibile utilizzarlo gratuitamente, ricordiamo che la ripubblicazione del codice è soggetta al nostro Regolamento.
FAQ: I am gradually phasing out my Patreon because of the time it takes to maintain.
BTC: 35PdMMMXFCvPjXKwn8wsRFNwMEPgStaKUJ
Test my strategies on CryptoRobotics: cryptorobotics.co/?trade=f23b09
BTC: 35PdMMMXFCvPjXKwn8wsRFNwMEPgStaKUJ
Test my strategies on CryptoRobotics: cryptorobotics.co/?trade=f23b09
Declinazione di responsabilità
Le informazioni e le pubblicazioni non sono intese come, e non costituiscono, consulenza o raccomandazioni finanziarie, di investimento, di trading o di altro tipo fornite o approvate da TradingView. Per ulteriori informazioni, consultare i Termini di utilizzo.
Script open-source
Nello spirito di TradingView, l'autore di questo script lo ha reso open source, in modo che i trader possano esaminarne e verificarne la funzionalità. Complimenti all'autore! Sebbene sia possibile utilizzarlo gratuitamente, ricordiamo che la ripubblicazione del codice è soggetta al nostro Regolamento.
FAQ: I am gradually phasing out my Patreon because of the time it takes to maintain.
BTC: 35PdMMMXFCvPjXKwn8wsRFNwMEPgStaKUJ
Test my strategies on CryptoRobotics: cryptorobotics.co/?trade=f23b09
BTC: 35PdMMMXFCvPjXKwn8wsRFNwMEPgStaKUJ
Test my strategies on CryptoRobotics: cryptorobotics.co/?trade=f23b09
Declinazione di responsabilità
Le informazioni e le pubblicazioni non sono intese come, e non costituiscono, consulenza o raccomandazioni finanziarie, di investimento, di trading o di altro tipo fornite o approvate da TradingView. Per ulteriori informazioni, consultare i Termini di utilizzo.