OPEN-SOURCE SCRIPT
Volume-Adjusted Bollinger Bands
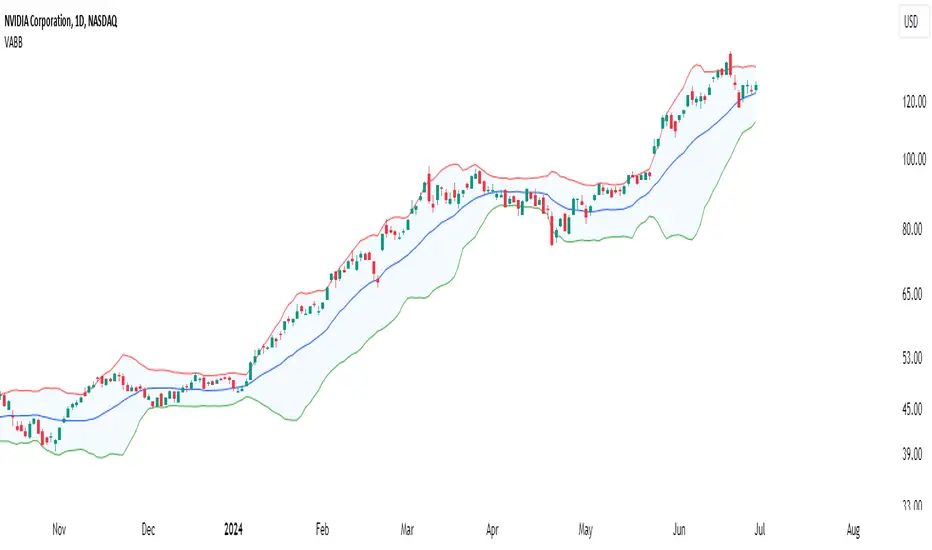
The Volume-Adjusted Bollinger Bands (VABB) indicator is an advanced technical analysis tool that enhances the traditional Bollinger Bands by incorporating volume data. This integration allows the bands to dynamically adjust based on market volume, providing a more nuanced view of price movements and volatility. The key qualities of the VABB indicator include:
How to Use and Interpret the VABB Indicator
To use the VABB indicator, you need to set it up on your trading platform with the following parameters:
Interpretation
Practical Example
Conclusion
The Volume-Adjusted Bollinger Bands (VABB) indicator is a powerful tool that enhances traditional Bollinger Bands by incorporating volume data. This dynamic adjustment helps traders better understand market conditions and make more informed trading decisions. By using the VABB indicator, traders can identify significant price movements supported by volume, improving the reliability of their trading signals.
The Volume-Adjusted Bollinger Bands (VABB) indicator is provided for educational and informational purposes only. It is not financial advice and should not be construed as a recommendation to buy, sell, or hold any financial instrument. Trading involves significant risk of loss and is not suitable for all investors. Past performance is not indicative of future results.
1. Dynamic Adjustment with Volume: Traditional Bollinger Bands are based solely on price data and standard deviations. The VABB indicator adjusts the width of the bands based on the volume ratio, making them more responsive to changes in market activity. This means that during periods of high volume, the bands will expand, and during periods of low volume, they will contract. This adjustment helps to reinforce the significance of price movements relative to the central line (VWMA).
2. Volume-Weighted Moving Average (VWMA): Instead of using a simple moving average (SMA) as the central line, the VABB uses the VWMA, which weights prices by volume. This provides a more accurate representation of the average price level, considering the trading volume.
3. Enhanced Signal Reliability: By incorporating volume, the VABB can filter out false signals that might occur in low-volume conditions. This makes the indicator particularly useful for identifying significant price movements that are supported by strong trading activity.
How to Use and Interpret the VABB Indicator
To use the VABB indicator, you need to set it up on your trading platform with the following parameters:
1. BB Length: The number of periods for calculating the Bollinger Bands (default is 20).
2. BB Multiplier: The multiplier for the standard deviation to set the width of the Bollinger Bands (default is 2.0).
3. Volume MA Length: The number of periods for calculating the moving average of the volume (default is 14).
Volume Ratio Smoothing Length: The number of periods for smoothing the volume ratio (default is 5).
Interpretation
1.Trend Identification: The VWMA serves as the central line. When the price is above the VWMA, it indicates an uptrend, and when it is below, it indicates a downtrend. The direction of the VWMA itself can also signal the trend's strength.
2. Volatility and Volume Analysis: The width of the VABB bands reflects both volatility and volume. Wider bands indicate high volatility and/or high volume, suggesting significant price movements. Narrower bands indicate low volatility and/or low volume, suggesting consolidation.
3. Trading Signals:
Breakouts: A price move outside the adjusted upper or lower bands can signal a potential breakout. High volume during such moves reinforces the breakout's validity.
Reversals: When the price touches or crosses the adjusted upper band, it may indicate overbought conditions, while touching or crossing the adjusted lower band may indicate oversold conditions. These conditions can signal potential reversals, especially if confirmed by other indicators or volume patterns.
Volume Confirmation: The volume ratio component helps confirm the strength of price movements. For instance, a breakout accompanied by a high volume ratio is more likely to be sustained than one with a low volume ratio.
Practical Example
Bullish Scenario: If the price crosses above the adjusted upper band with a high volume ratio, it suggests a strong bullish breakout. Traders might consider entering a long position, setting a stop-loss just below the VWMA or the lower band.
Bearish Scenario: Conversely, if the price crosses below the adjusted lower band with a high volume ratio, it suggests a strong bearish breakout. Traders might consider entering a short position, setting a stop-loss just above the VWMA or the upper band.
Conclusion
The Volume-Adjusted Bollinger Bands (VABB) indicator is a powerful tool that enhances traditional Bollinger Bands by incorporating volume data. This dynamic adjustment helps traders better understand market conditions and make more informed trading decisions. By using the VABB indicator, traders can identify significant price movements supported by volume, improving the reliability of their trading signals.
The Volume-Adjusted Bollinger Bands (VABB) indicator is provided for educational and informational purposes only. It is not financial advice and should not be construed as a recommendation to buy, sell, or hold any financial instrument. Trading involves significant risk of loss and is not suitable for all investors. Past performance is not indicative of future results.
Script open-source
Nello spirito di TradingView, l'autore di questo script lo ha reso open source, in modo che i trader possano esaminarne e verificarne la funzionalità. Complimenti all'autore! Sebbene sia possibile utilizzarlo gratuitamente, ricordiamo che la ripubblicazione del codice è soggetta al nostro Regolamento.
Plan the trade ⚡ Trade the plan
Declinazione di responsabilità
Le informazioni e le pubblicazioni non sono intese come, e non costituiscono, consulenza o raccomandazioni finanziarie, di investimento, di trading o di altro tipo fornite o approvate da TradingView. Per ulteriori informazioni, consultare i Termini di utilizzo.