OPEN-SOURCE SCRIPT
Aggiornato BB %b & RSI Indicator & Alert
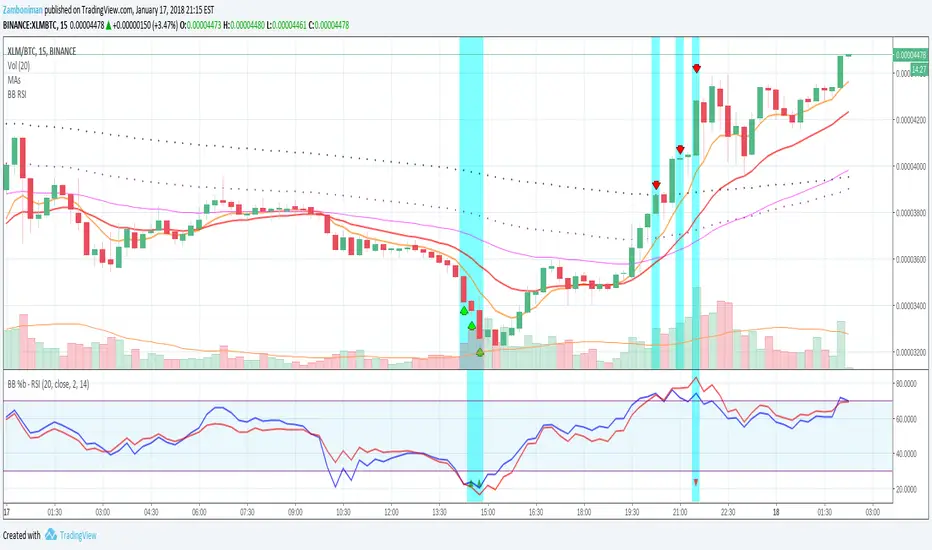
Indicator for displaying both RSI and a normalized Bollinger Bands %b (Usual 0 - 1 range of BB normalized to the 30 - 70 OB/OS range of RSI) simultaneously.
Settable periods for RSI and BB, and settable standard deviation for BB.
When both Bollinger Bands %b and RSI are OB/OS then the column will turn blue and a buy/sell arrow will appear in the indicator provided other conditions pertaining to the OB/OS condition in one of the last two candles are also met.
You can also set an alert on the arrow indicator appearing.
I use this mainly for Cryptocurrencies, though it is usable in Forex, for shorter time periods to indicate possible trade opportunities.
Note di rilascio
Small bugfixNote di rilascio
Small bugfixNote di rilascio
- Several enhancements and tweaks- Added selectable combination alert or individual buy or sell alerts
- Moved buy and sell arrows to opposite sides to enhance visibility (often obscured by plot lines before)
Note di rilascio
Fixed typo in alert.Note di rilascio
small fixNote di rilascio
Removed limitation for up/down arrows only on 60 minute charts or less. Added separate alerts for buy or sell. A few other small tweaks.Note di rilascio
Small tweaks.Script open-source
In pieno spirito TradingView, il creatore di questo script lo ha reso open-source, in modo che i trader possano esaminarlo e verificarne la funzionalità. Complimenti all'autore! Sebbene sia possibile utilizzarlo gratuitamente, ricorda che la ripubblicazione del codice è soggetta al nostro Regolamento.
Declinazione di responsabilità
Le informazioni ed i contenuti pubblicati non costituiscono in alcun modo una sollecitazione ad investire o ad operare nei mercati finanziari. Non sono inoltre fornite o supportate da TradingView. Maggiori dettagli nelle Condizioni d'uso.
Script open-source
In pieno spirito TradingView, il creatore di questo script lo ha reso open-source, in modo che i trader possano esaminarlo e verificarne la funzionalità. Complimenti all'autore! Sebbene sia possibile utilizzarlo gratuitamente, ricorda che la ripubblicazione del codice è soggetta al nostro Regolamento.
Declinazione di responsabilità
Le informazioni ed i contenuti pubblicati non costituiscono in alcun modo una sollecitazione ad investire o ad operare nei mercati finanziari. Non sono inoltre fornite o supportate da TradingView. Maggiori dettagli nelle Condizioni d'uso.