OPEN-SOURCE SCRIPT
Cross-Correlation Lead/Lag Analyzer

Cross-Correlation Lead/Lag Analyzer (XCorr)
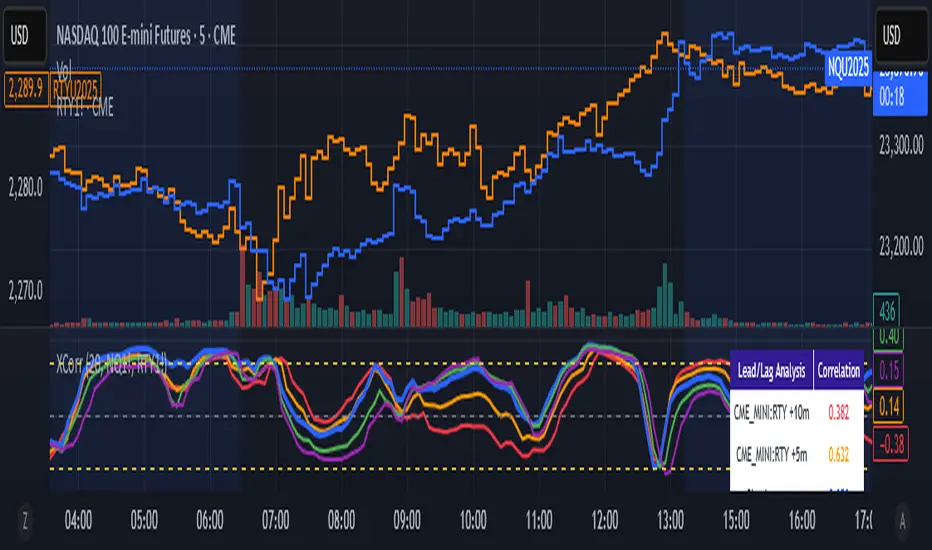
Discover which instrument moves first with advanced cross-correlation analysis.
This indicator analyzes the lead/lag relationship between any two financial instruments using rolling cross-correlation at multiple time offsets. Perfect for pairs trading, market timing, and understanding inter-market relationships.
Key Features:
How to Use:
Interpreting Results:
Popular Use Cases:
Technical Notes:
Cross-correlation measures linear relationships between two time series at different time lags. This implementation uses Pearson correlation with adjustable periods, calculating correlations from -2 to +2 period offsets to detect leading/lagging behavior.
Perfect for quantitative analysts, pairs traders, and anyone studying inter-market relationships.
Discover which instrument moves first with advanced cross-correlation analysis.
This indicator analyzes the lead/lag relationship between any two financial instruments using rolling cross-correlation at multiple time offsets. Perfect for pairs trading, market timing, and understanding inter-market relationships.
Key Features:
- Universal compatibility - Works with any two symbols (stocks, futures, forex, crypto, commodities)
- Multi-timeframe analysis - Automatically adjusts lag periods based on your chart timeframe
- Real-time correlation table - Shows current correlation values for all lag scenarios
- Visual lead/lag detection - Color-coded plots make it easy to spot which instrument leads
- Smart "Best" indicator - Automatically identifies the strongest relationship
How to Use:
- Set your symbols in the indicator settings (default: NQ1! vs RTY1!)
- Adjust correlation length (default: 20 periods for smooth but responsive analysis)
- Watch the colored lines:
• Red/Orange: Symbol 2 leads Symbol 1 by 1-2 periods
• Blue: Instruments move simultaneously
• Green/Purple: Symbol 1 leads Symbol 2 by 1-2 periods - Check the table for exact correlation values and the "Best" relationship
Interpreting Results:
- Correlation > 0.7: Strong positive relationship
- Correlation 0.3-0.7: Moderate relationship
- Correlation < 0.3: Weak/no relationship
- Highest line indicates the optimal timing relationship
Popular Use Cases:
- Index Futures: NQ vs ES, RTY vs IWM
- Sector Rotation: XLF vs XLK, QQQ vs SPY
- Commodities: GC vs SI, CL vs NG
- Currency Pairs: EURUSD vs GBPUSD
- Crypto: BTC vs ETH correlation analysis
Technical Notes:
Cross-correlation measures linear relationships between two time series at different time lags. This implementation uses Pearson correlation with adjustable periods, calculating correlations from -2 to +2 period offsets to detect leading/lagging behavior.
Perfect for quantitative analysts, pairs traders, and anyone studying inter-market relationships.
Script open-source
Nello spirito di TradingView, l'autore di questo script lo ha reso open source, in modo che i trader possano esaminarne e verificarne la funzionalità. Complimenti all'autore! Sebbene sia possibile utilizzarlo gratuitamente, ricordiamo che la ripubblicazione del codice è soggetta al nostro Regolamento.
Declinazione di responsabilità
Le informazioni e le pubblicazioni non sono intese come, e non costituiscono, consulenza o raccomandazioni finanziarie, di investimento, di trading o di altro tipo fornite o approvate da TradingView. Per ulteriori informazioni, consultare i Termini di utilizzo.