OPEN-SOURCE SCRIPT
ATR+
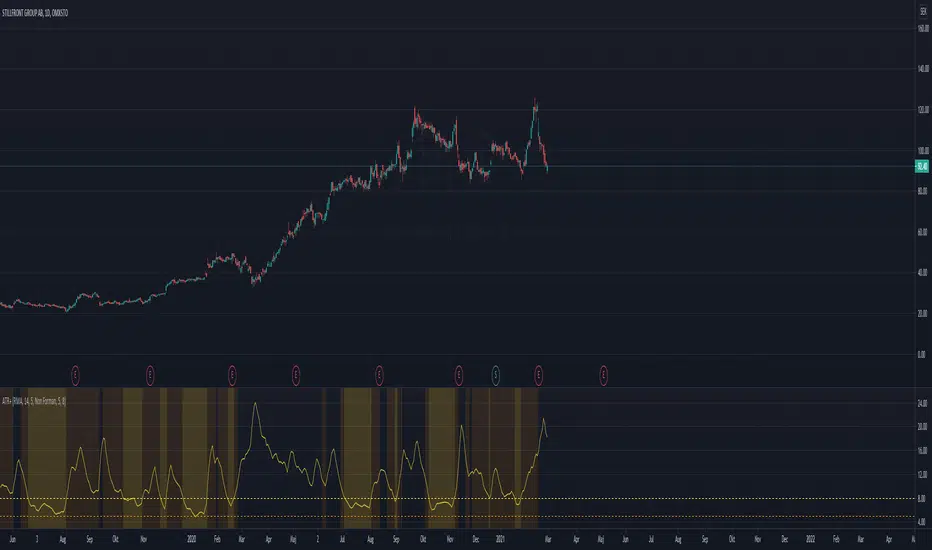
(Experimental)
I often use the ATR as a volatility filter, to get better entries or to just get a quick understand of the volatility when screening different stocks.
With this indicator you can use the ATR in a few different ways:
-- Dynamic ATR --
To get more comparability between stocks I use a dynamic/normalized ATR, so I've experimented with two different methods.
ATR% can be calculated using John Forman’s approach called Normalized ATR (ATR / Close * 100). Or it can be calculated using what I call "Non Forman",
where the normalization happens to the true range and not to the average true range (average of (TR / Close * 100)). I think this method is "cleaner",
though the difference between the two is minimal. For more on this see macroption.com/normalized-atr/
You can chose between normal ATR (not normalized), Forman's normazation method, and "Non-Forman" normalization.
-- Smoothed ATR --
I originally used an ATR on a higher timeframe to get an idea of the overall volatility. But with higher time frames you always end up lag (or repainting
issues when combining into an indicator). So I expertimented on smoothing the true range, by including several bars into the calculation. I most trade
on a daily time frame so to my default "smoothing" is calculating the true range based on the last 5 days. This pretty much equals how the weekly TR
would be calculated, but since it updates daily we get a different result.
You can chose between displaying the standard ATR, the smoothed ATR or both.
-- Thresholds --
To make it more clear and visually more appealing I added thresholds and I'm plotting warning zones for low volatily.
-- Moving Average Method --
I think the best results from ATR comes when using RMA. But since I wanted to experiment with different options, the moving averages can be done using
RMA, SMA, EMA, Hull MA, or WMA.
Script open-source
Nello spirito di TradingView, l'autore di questo script lo ha reso open source, in modo che i trader possano esaminarne e verificarne la funzionalità. Complimenti all'autore! Sebbene sia possibile utilizzarlo gratuitamente, ricordiamo che la ripubblicazione del codice è soggetta al nostro Regolamento.
Declinazione di responsabilità
Le informazioni e le pubblicazioni non sono intese come, e non costituiscono, consulenza o raccomandazioni finanziarie, di investimento, di trading o di altro tipo fornite o approvate da TradingView. Per ulteriori informazioni, consultare i Termini di utilizzo.