OPEN-SOURCE SCRIPT
ETI Indicator
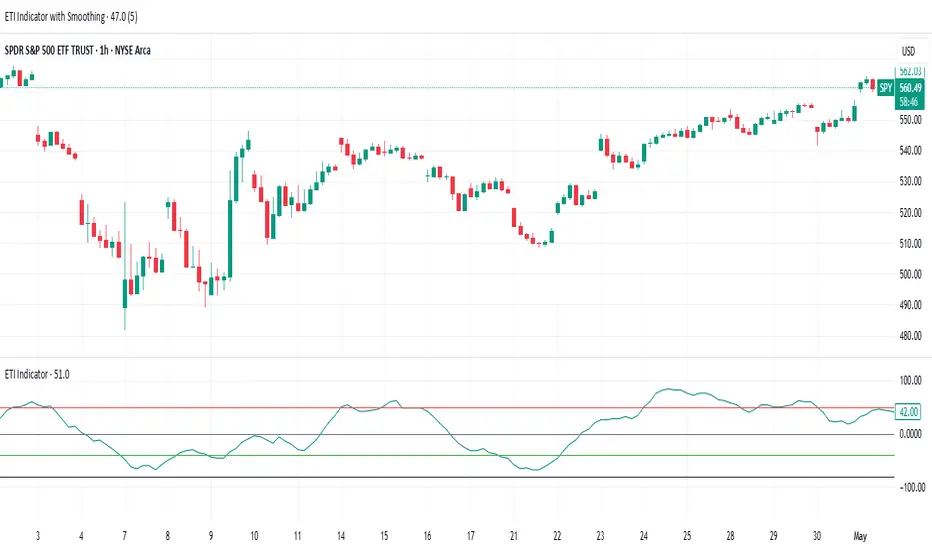
The Ensemble Technical Indicator (ETI) is a script that combines multiple established indicators into one single powerful indicator. Specifically, it takes a number of technical indicators and then converts them into +1 to represent a bullish trend, or a -1 to represent a bearish trend. It then adds these values together and takes the running sum over the past 20 days.
The ETI is composed of the following indicators and converted to +1 or -1 using the following criteria:
Simple Moving Average (10 days): When the price is above the 10-day simple moving averaging, +1, when below -1
Weighted Moving Average (10 days): Similar to the SMA 10, when the the price is above the 10-day weighted moving average, +1, when below -1
Stochastic K%: If the current Stochastic K% is greater than the previous value, then +1, else -1.
Stochastic D%: Similar to the Stochastic K%, when the current Stochastic D% is greater than the previous value, +1, else -1.
MACD Difference: First subtract the MACD signal (i.e. the moving average) from the MACD value and if the current value is higher than the previous value, then +1, else -1.
William's R%: If the current William's R% is greater than the previous one, then +1, else -1.
William's Accumulation/Distribution: If the current William's AD value is greater than the previous value, then +1, else -1.
Commodity Channel Index: If the Commodity Channel Index is greater than 200 (overbought), then -1, if it is less than -200 (oversold) then +1. When it is between those values, if the current value is greater than the previous value then +1, else -1.
Relative Strength Index: If the Relative Strength Index is over 70 (overbought) then -1 and if under 30 (oversold) then +1. If the Relative Strength Indicator is between those values then if the current value is higher than the previous value +1, else -1.
Momentum (9 days): If the momentum value is greater than 0, then +1, else -1.
Again, once these values have been calculated and converted, they are added up to produce a single value. This single value is then summed across the previous 20 candles to produce a running sum.
By coalescing multiple technical indicators into a single value across time, traders can better understand how multiple inter-related indicators are behaving at once; high scores indicate that numerous indicators are showing bullish signals indicating a potential or ongoing uptrend (and vice-versa with low scores).
Additional Features
Numerous smoothing transformations have also been added (e.g. gaussian smoothing) to remove some of the noise might exist.
Suggested Use
It is recommended that stocks are shorted when the cross below 0, and are bought when the ETI crosses above -40. Arrows can be shown on the indicator to show these points. However feel free to use levels that work best for you.
Traditionally, I have treated values above +50 as overbought and below -40 as undersold (with -80 indicating extremely oversold); however these levels could also indicate either upwards and downwards momentum so taking a position based on where the ETI is (rather than crossing levels) should be done with caution.
Script open-source
Nello spirito di TradingView, l'autore di questo script lo ha reso open source, in modo che i trader possano esaminarne e verificarne la funzionalità. Complimenti all'autore! Sebbene sia possibile utilizzarlo gratuitamente, ricordiamo che la ripubblicazione del codice è soggetta al nostro Regolamento.
Declinazione di responsabilità
Le informazioni e le pubblicazioni non sono intese come, e non costituiscono, consulenza o raccomandazioni finanziarie, di investimento, di trading o di altro tipo fornite o approvate da TradingView. Per ulteriori informazioni, consultare i Termini di utilizzo.