OPEN-SOURCE SCRIPT
TICK Price Label Colors[Salty]

The ticker symbol for the NYSE CUMULATIVE Tick Index is TICK. The Tick Index is a short-term indicator that shows the number of stocks trading up minus the number of stocks trading down. Traders can use this ratio to make quick trading decisions based on market movement. For example, a positive tick index can indicate market optimism, while readings of +1,000 and -1,000 can indicate overbought or oversold conditions.
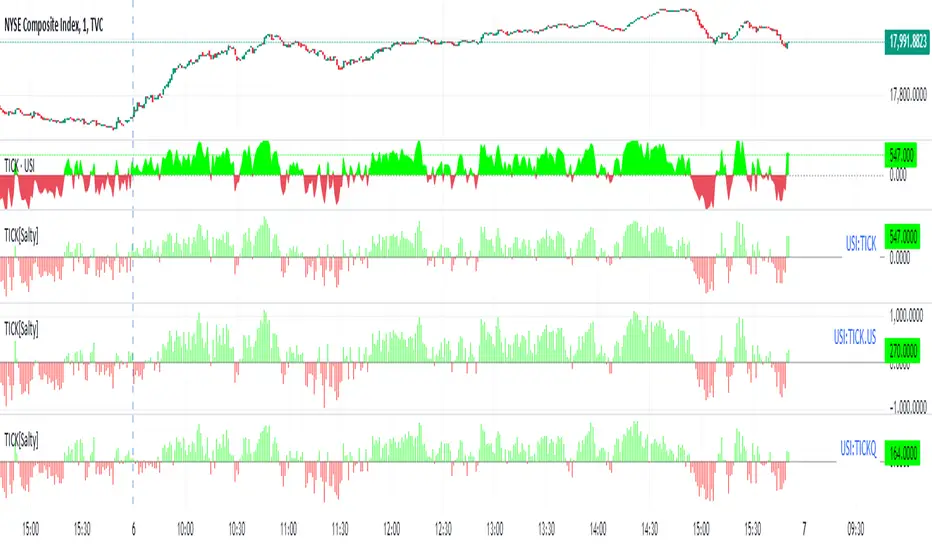
This script is used to color code the price label of the Symbol values zero or above in Green(default), and values below zero in red(default). For a dynamic symbol like the TICK this tells me the market is bullish when Green or Bearish when Red. I was previously using the baseline style with a Base level of 50 to accomplish this view of the symbol, but it was always difficult to maintain the zero level at the zero TICK value. This indicator is always able to color code the price label properly. Also, it has the benefit of setting the timeframe to 1 second(default) that is maintained even when the chart timeframe is changed.
Update: Added the ability to show the TICK Symbol to support viewing multiple TICK tickers at once as shown.
Script open-source
Nello spirito di TradingView, l'autore di questo script lo ha reso open source, in modo che i trader possano esaminarne e verificarne la funzionalità. Complimenti all'autore! Sebbene sia possibile utilizzarlo gratuitamente, ricordiamo che la ripubblicazione del codice è soggetta al nostro Regolamento.
Declinazione di responsabilità
Le informazioni e le pubblicazioni non sono intese come, e non costituiscono, consulenza o raccomandazioni finanziarie, di investimento, di trading o di altro tipo fornite o approvate da TradingView. Per ulteriori informazioni, consultare i Termini di utilizzo.