PROTECTED SOURCE SCRIPT
Candle Sentiment Volume Flow
Candle Sentiment Volume Flow (CSVF)
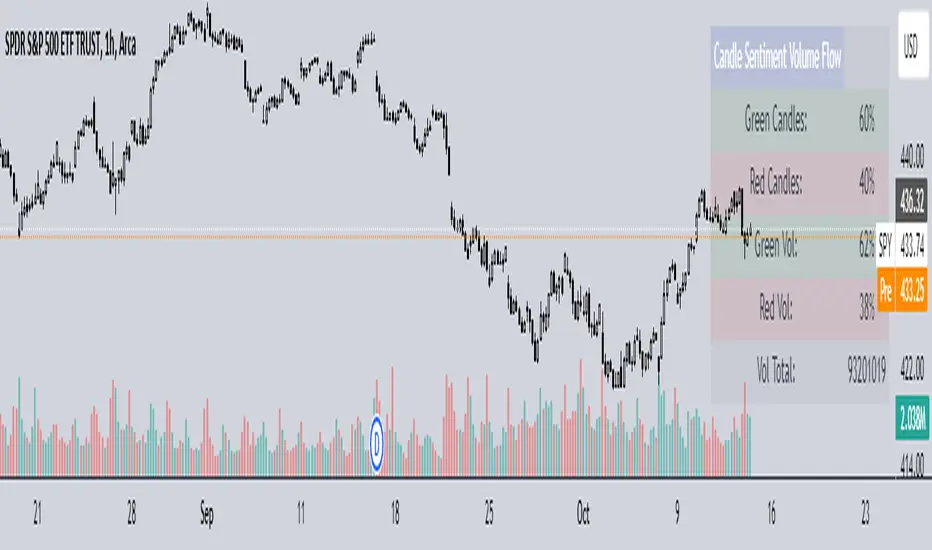
NOTE: The indicator showcased in the 1H chart is utilized on the ticker 'SPY'.

The Candle Sentiment Volume Flow (CSVF) is a custom trading indicator designed to analyze and visualize the momentum and volume flow of a financial instrument within a specified range of candles in a chart. It provides traders with a snapshot of the prevailing market sentiment by calculating the percentage of green (bullish) and red (bearish) candles and the volume associated with them over a defined range of periods (X Range).
Core Components:
1. Candle Counting:
- Green Count: Total number of green (bullish) candles in the defined range.
- Red Count: Total number of red (bearish) candles in the defined range.
2. Volume Calculation:
- Green Volume: Cumulative volume of green candles.
- Red Volume: Cumulative volume of red candles.
3. Percentage Calculation:
- Green Percentage: (Green Count / X Range) * 100
- Red Percentage: (Red Count / X Range) * 100
- Green Volume Percentage: (Green Volume / Total Volume) * 100
- Red Volume Percentage: (Red Volume / Total Volume) * 100
4. User-Defined Parameters:
- Candle Range (X Range): Number of candles to be considered for calculations.
- Green Threshold: User-defined percentage to identify significant bullish sentiment.
- Red Threshold: User-defined percentage to identify significant bearish sentiment.
Visual Component:
- Table Display:
A table is displayed on the top right of the chart, providing a quick overview of the calculated percentages and total volume.
The table is color-coded for easy interpretation and includes:
- Green and Red Candle Percentages
- Green and Red Volume Percentages
- Total Volume
Functional Workflow:
- The indicator loops through the past 'X' candles within the defined range, counting the number of green and red candles and accumulating their respective volumes.
- It calculates the percentage of green and red candles and the percentage of volume associated with them.
- The calculated values are displayed in a table on the chart, providing a clear and concise view of the candle sentiment and volume flow within the specified range.
NOTE: The indicator showcased in the 1H chart is utilized on the ticker 'SPY'.
The Candle Sentiment Volume Flow (CSVF) is a custom trading indicator designed to analyze and visualize the momentum and volume flow of a financial instrument within a specified range of candles in a chart. It provides traders with a snapshot of the prevailing market sentiment by calculating the percentage of green (bullish) and red (bearish) candles and the volume associated with them over a defined range of periods (X Range).
Core Components:
1. Candle Counting:
- Green Count: Total number of green (bullish) candles in the defined range.
- Red Count: Total number of red (bearish) candles in the defined range.
2. Volume Calculation:
- Green Volume: Cumulative volume of green candles.
- Red Volume: Cumulative volume of red candles.
3. Percentage Calculation:
- Green Percentage: (Green Count / X Range) * 100
- Red Percentage: (Red Count / X Range) * 100
- Green Volume Percentage: (Green Volume / Total Volume) * 100
- Red Volume Percentage: (Red Volume / Total Volume) * 100
4. User-Defined Parameters:
- Candle Range (X Range): Number of candles to be considered for calculations.
- Green Threshold: User-defined percentage to identify significant bullish sentiment.
- Red Threshold: User-defined percentage to identify significant bearish sentiment.
Visual Component:
- Table Display:
A table is displayed on the top right of the chart, providing a quick overview of the calculated percentages and total volume.
The table is color-coded for easy interpretation and includes:
- Green and Red Candle Percentages
- Green and Red Volume Percentages
- Total Volume
Functional Workflow:
- The indicator loops through the past 'X' candles within the defined range, counting the number of green and red candles and accumulating their respective volumes.
- It calculates the percentage of green and red candles and the percentage of volume associated with them.
- The calculated values are displayed in a table on the chart, providing a clear and concise view of the candle sentiment and volume flow within the specified range.
Script protetto
Questo script è pubblicato come codice protetto. Tuttavia, è possibile utilizzarle liberamente e senza alcuna limitazione – ulteriori informazioni qui.
Declinazione di responsabilità
Le informazioni e le pubblicazioni non sono intese come, e non costituiscono, consulenza o raccomandazioni finanziarie, di investimento, di trading o di altro tipo fornite o approvate da TradingView. Per ulteriori informazioni, consultare i Termini di utilizzo.