OPEN-SOURCE SCRIPT
Aggiornato Stochastic & RSI
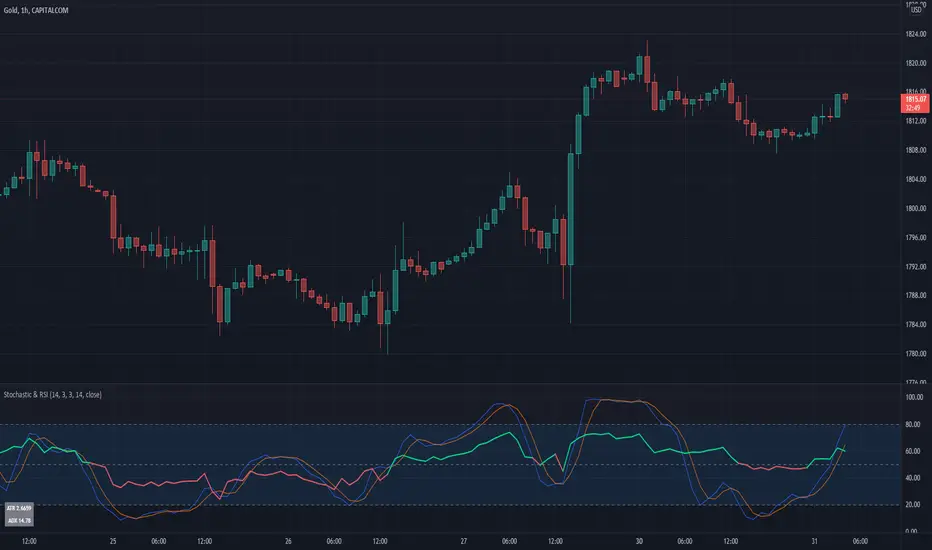
This script is a simple extension of the Built-In Stochastic RSI that also plots the RSI and prints the values of ATR and ADX of the last bar of the current timeframe to a small table in the corner.
The script can be used to define the entry for a trade when the stochastics crossed and RSI is below or above 0.50 (for going long or short).
 BTCUSD
I like to use the Stochastics and RSI indicators for pullback strategies, and with this inidcator you dont have to add both indicators to your setup. The ATR can be used to define the value of your stop-loss and the ADX (e.g. > 25) give you a hint for the strength of the current trend.
The script can be used to define the entry for a trade when the stochastics crossed and RSI is below or above 0.50 (for going long or short).
I like to use the Stochastics and RSI indicators for pullback strategies, and with this inidcator you dont have to add both indicators to your setup. The ATR can be used to define the value of your stop-loss and the ADX (e.g. > 25) give you a hint for the strength of the current trend.
Note di rilascio
Set the decimals of the ATR to 4 digitsNote di rilascio
Stochastics separated from RSI and color option for RSI addedNote di rilascio
Update name and chartNote di rilascio
Stochastics based on RSI, not close, low and highNote di rilascio
Add alerts for overbought and oversold entriesNote di rilascio
Register alert for overbought or oversoldNote di rilascio
Typo correctedNote di rilascio
TypoNote di rilascio
Alert on stochastics cross when oversold or overboughtNote di rilascio
Upper and lower level of bands as inputNote di rilascio
Length RSI and stochastics separatedNote di rilascio
Second RSI added for longer term momentum and trendNote di rilascio
RSI-based EMA addedScript open-source
Nello spirito di TradingView, l'autore di questo script lo ha reso open source, in modo che i trader possano esaminarne e verificarne la funzionalità. Complimenti all'autore! Sebbene sia possibile utilizzarlo gratuitamente, ricordiamo che la ripubblicazione del codice è soggetta al nostro Regolamento.
Access our indicators from: indivisionx.com
Declinazione di responsabilità
Le informazioni e le pubblicazioni non sono intese come, e non costituiscono, consulenza o raccomandazioni finanziarie, di investimento, di trading o di altro tipo fornite o approvate da TradingView. Per ulteriori informazioni, consultare i Termini di utilizzo.
Script open-source
Nello spirito di TradingView, l'autore di questo script lo ha reso open source, in modo che i trader possano esaminarne e verificarne la funzionalità. Complimenti all'autore! Sebbene sia possibile utilizzarlo gratuitamente, ricordiamo che la ripubblicazione del codice è soggetta al nostro Regolamento.
Access our indicators from: indivisionx.com
Declinazione di responsabilità
Le informazioni e le pubblicazioni non sono intese come, e non costituiscono, consulenza o raccomandazioni finanziarie, di investimento, di trading o di altro tipo fornite o approvate da TradingView. Per ulteriori informazioni, consultare i Termini di utilizzo.