PROTECTED SOURCE SCRIPT
StDev RSI +
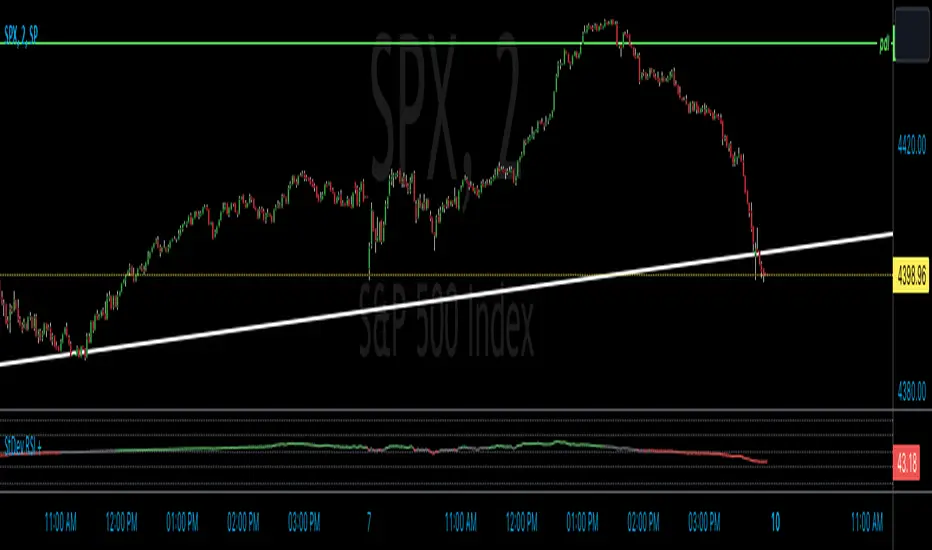
Alright, let's dive into this script, which I like to call 'StDev RSI+'. It's a unique take on the classic Relative Strength Index (RSI), a popular tool among traders that helps identify potential overbought or oversold conditions in a stock. But what makes our StDev RSI+ special is how it normalizes price changes against the standard deviation, taking into account the volatility of the stock prices.
The main difference between the original script and this new 'StDev RSI+' script lies in the method of normalization used to calculate price changes. In the original script, the normalization was done using the average of current and previous closing prices. This approach is quite simple and direct, essentially comparing the day-to-day change relative to the average price.
However, the StDev RSI+ script takes a more sophisticated approach. It normalizes the price changes against the standard deviation of the closing prices over a defined period. This method takes into account the volatility of the stock price, providing a measure of how much the prices have been fluctuating during that period.
This means the StDev RSI+ script doesn't just look at the raw change in price, but rather it considers how significant that change is compared to the usual volatility of the stock. So, a big price change may not be considered as significant if the stock is typically very volatile. Conversely, a smaller price change could be seen as more meaningful if the stock is usually quite stable.
Another notable difference is the length of the period used for calculations. While the original script used a period of 14 units (days, weeks, etc.), the StDev RSI+ script uses a period of 153 units. This longer timeframe will smooth out the RSI line and make it less sensitive to individual price changes, but more reflective of longer-term trends.
In essence, while both scripts aim to provide useful trading signals through the RSI, they offer different perspectives. The original script provides a more straightforward, immediate view of price changes, while the StDev RSI+ script offers a volatility-adjusted, longer-term perspective.
Script protetto
Questo script è pubblicato come codice protetto. Tuttavia, è possibile utilizzarlo liberamente e senza alcuna limitazione – per saperne di più clicca qui.
Declinazione di responsabilità
Le informazioni ed i contenuti pubblicati non costituiscono in alcun modo una sollecitazione ad investire o ad operare nei mercati finanziari. Non sono inoltre fornite o supportate da TradingView. Maggiori dettagli nelle Condizioni d'uso.