OPEN-SOURCE SCRIPT
Candle Strength Analysis

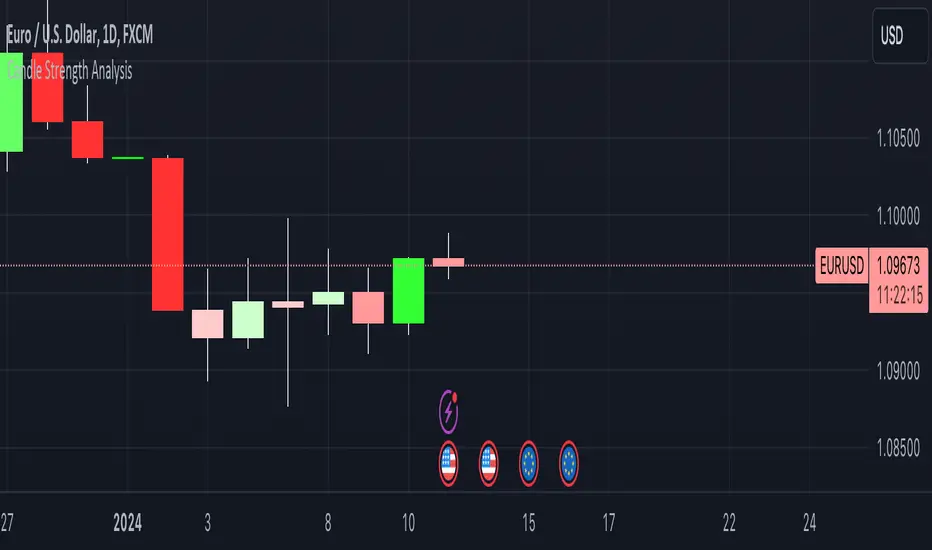
View candles differently with this new indicator designed to simply visualise and analyse price movements on your chart!
The more vibrant the colour, the stronger the conviction of its respective candle.
This simple script calculates the closing price as a percentage within the candles high/low range. A colour/strength rating is then assigned to the candle based on where this close price sits within the range.
Strong coloured candles occur when the close is very close to a high or low.
User defined percentage and colour inputs allow for quick personalisation and flexibility.
An additional wick imbalance feature identifies when a candle has a larger wick than its body, which may be used to identify a ranging market or shift in trader sentiment.
For any questions, concerns, or requests, please reach out to me in the comments below.
- The Pine Guru
Script open-source
Nello spirito di TradingView, l'autore di questo script lo ha reso open source, in modo che i trader possano esaminarne e verificarne la funzionalità. Complimenti all'autore! Sebbene sia possibile utilizzarlo gratuitamente, ricordiamo che la ripubblicazione del codice è soggetta al nostro Regolamento.
Declinazione di responsabilità
Le informazioni e le pubblicazioni non sono intese come, e non costituiscono, consulenza o raccomandazioni finanziarie, di investimento, di trading o di altro tipo fornite o approvate da TradingView. Per ulteriori informazioni, consultare i Termini di utilizzo.