OPEN-SOURCE SCRIPT
Aggiornato Bitfinex BTC longs/total ratio
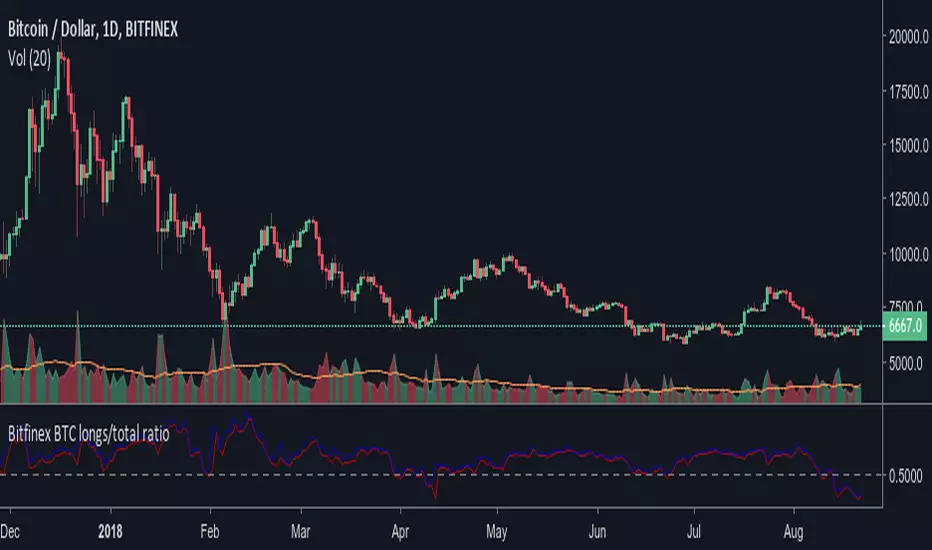
Ratio of bitfinex longs versus the total btc in positions. Maybe a good indicator of market sentiment. It allows you to see too where were people taking profit or closing positions. Remember that ratio going up doesn't necesarily mean more longs positions are being added. It could mean shorts are closing position massively. The conversely is also true.
The rate above 0.5 doesn't necesarily bullish, though, and the indicator is "timeframe" agnostic. So take into account that there could be tons of longs positions that were opened since back before summer 2017, It seems to be too of positions opened at prices below 4.000$. That's why the average seems to be around 0.6.
The blue lines indicates current ratio (or on close for past bars). The red line is the max ratio (higher shorts versus lowest longs).
Note di rilascio
Now, it adds the BTCEUR and BTCJPY pairs to the calculation, in case the metric changes in some point in the future, but so far it is irrelevant since the 98% of positions are in the BTCUSD market.Note di rilascio
- Removed EUR/JPY positions. Amounts too tiny in comparision with BTCUSD and the load time of the scripts increases significantly.- Now you can see the change ratio of longs (green), shorts (red) and shorts+longs (gray) per candle. For example, a value of -0.1 for shorts means the shorts has drop a 10% respect to the previous bar/candle.
- The longs/total ratio (blue) now applies a -0.5, to center the line with respect to the other lines, so they are more comfortable to see. A value of 0.1 means the longs/total ratio is 0.5+0.1, or 60% of total.
Script open-source
Nello spirito di TradingView, l'autore di questo script lo ha reso open source, in modo che i trader possano esaminarne e verificarne la funzionalità. Complimenti all'autore! Sebbene sia possibile utilizzarlo gratuitamente, ricordiamo che la ripubblicazione del codice è soggetta al nostro Regolamento.
Declinazione di responsabilità
Le informazioni e le pubblicazioni non sono intese come, e non costituiscono, consulenza o raccomandazioni finanziarie, di investimento, di trading o di altro tipo fornite o approvate da TradingView. Per ulteriori informazioni, consultare i Termini di utilizzo.