OPEN-SOURCE SCRIPT
Aggiornato Trend Finder with Coefficient of Variation
Coefficient of variation (“COV”) is a statistical measure used to describe the variability of values within a data set, it’s calculated by taking the standard deviation divided by the mean.
Traditionally, COV is applied to the expected returns of competing investment portfolios. A risk adverse investor prefers to accept a portfolio with a relatively lower COV value.
On the other hand, when applying COV to price charts, the difference is that instead of looking at expected returns, we now treat price as the source of data. We look at price from a moving average perspective. This script purely focuses on price.
What this indicator does:
Firstly, to go over the parameters:
Let ‘n’ be the lookback period for computing COV, and ‘m’ be the period for comparing the ranking of COVs.
Logics in a nutshell:
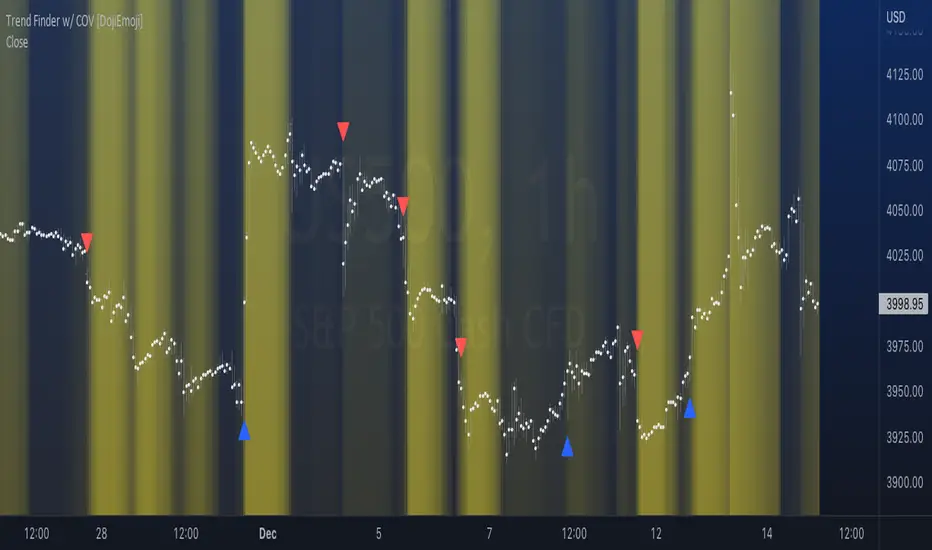
This program will (A) calculate the COV by dividing the moving standard deviation by moving average over ‘n’ bars, and then (B) illustrate the relationship of how COV at each bar ranks compared to COVs over past ‘m’ bars. We use a color scale (default black and yellow) for visualizing ranking in terms of percentiles. If COV is below its median value, then we assume that price is consolidating.
Hypothesis:
Using COV on top of regular SMA signals should reduce a lot of unwanted noise such as consecutive crossovers during ranging-periods. Traders want volatility, but not too much of it when sniping for entry opportunities (speaking of initial position; need to add to winning positions after, but this is for another topic). For this reason, the median value of COV is suitable as a metric for signals.
Applications:
We use the median value of COV to form a decision rule. A signal is generated when COV > median(COV,m), and the direction of trend is determined based on relative position of price with respect to sma(price,n). When the value of COV is increasing, it can also be thought of seeing Bollinger Bands beginning to bulge. When trends begin, this program will plot triangles to signify entry opportunities.
Traditionally, COV is applied to the expected returns of competing investment portfolios. A risk adverse investor prefers to accept a portfolio with a relatively lower COV value.
On the other hand, when applying COV to price charts, the difference is that instead of looking at expected returns, we now treat price as the source of data. We look at price from a moving average perspective. This script purely focuses on price.
What this indicator does:
Firstly, to go over the parameters:
Let ‘n’ be the lookback period for computing COV, and ‘m’ be the period for comparing the ranking of COVs.
Logics in a nutshell:
This program will (A) calculate the COV by dividing the moving standard deviation by moving average over ‘n’ bars, and then (B) illustrate the relationship of how COV at each bar ranks compared to COVs over past ‘m’ bars. We use a color scale (default black and yellow) for visualizing ranking in terms of percentiles. If COV is below its median value, then we assume that price is consolidating.
Hypothesis:
Using COV on top of regular SMA signals should reduce a lot of unwanted noise such as consecutive crossovers during ranging-periods. Traders want volatility, but not too much of it when sniping for entry opportunities (speaking of initial position; need to add to winning positions after, but this is for another topic). For this reason, the median value of COV is suitable as a metric for signals.
Applications:
We use the median value of COV to form a decision rule. A signal is generated when COV > median(COV,m), and the direction of trend is determined based on relative position of price with respect to sma(price,n). When the value of COV is increasing, it can also be thought of seeing Bollinger Bands beginning to bulge. When trends begin, this program will plot triangles to signify entry opportunities.
Note di rilascio
Added option to turn background colors on/offScript open-source
Nello spirito di TradingView, l'autore di questo script lo ha reso open source, in modo che i trader possano esaminarne e verificarne la funzionalità. Complimenti all'autore! Sebbene sia possibile utilizzarlo gratuitamente, ricordiamo che la ripubblicazione del codice è soggetta al nostro Regolamento.
Read Faster & Learn Anything with Coral AI! getcoralai.com//?ref=dojiemoji
Declinazione di responsabilità
Le informazioni e le pubblicazioni non sono intese come, e non costituiscono, consulenza o raccomandazioni finanziarie, di investimento, di trading o di altro tipo fornite o approvate da TradingView. Per ulteriori informazioni, consultare i Termini di utilizzo.
Script open-source
Nello spirito di TradingView, l'autore di questo script lo ha reso open source, in modo che i trader possano esaminarne e verificarne la funzionalità. Complimenti all'autore! Sebbene sia possibile utilizzarlo gratuitamente, ricordiamo che la ripubblicazione del codice è soggetta al nostro Regolamento.
Read Faster & Learn Anything with Coral AI! getcoralai.com//?ref=dojiemoji
Declinazione di responsabilità
Le informazioni e le pubblicazioni non sono intese come, e non costituiscono, consulenza o raccomandazioni finanziarie, di investimento, di trading o di altro tipo fornite o approvate da TradingView. Per ulteriori informazioni, consultare i Termini di utilizzo.