PROTECTED SOURCE SCRIPT
AlphaRSI Pro - Adaptive RSI with Trend Analysis
Overview
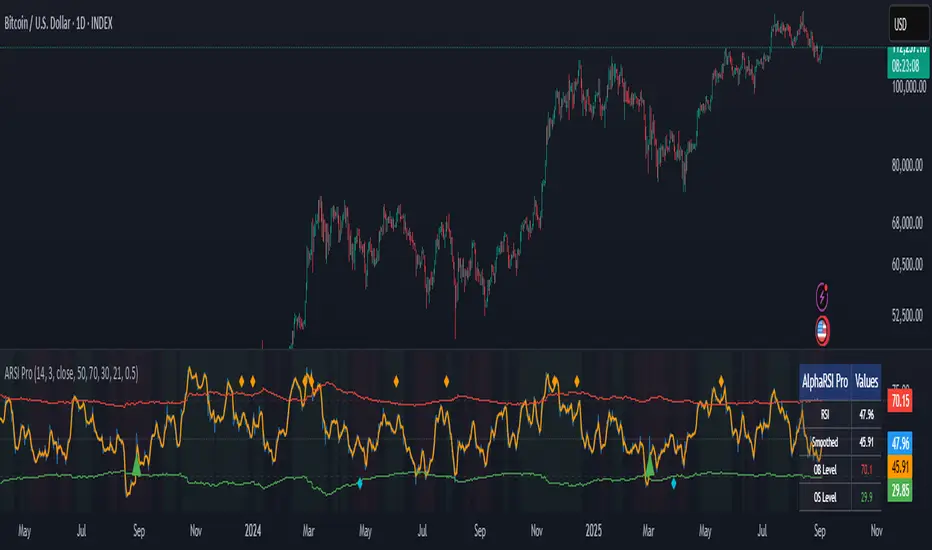
AlphaRSI Pro is a technical analysis indicator that enhances the traditional RSI by incorporating adaptive overbought/oversold levels, trend bias analysis, and divergence detection. This indicator addresses common limitations of standard RSI implementations through mathematical adaptations to market volatility.
Technical Methodology
1. Smoothed RSI Calculation
Applies weighted moving average smoothing to standard RSI(14)
Reduces noise while preserving momentum signals
Configurable smoothing period (default: 3)
2. Adaptive Level System
Mathematical Approach:
Calculates ATR-based volatility ratio: volatility_ratio = current_ATR / average_ATR
Applies dynamic adjustment: adaptive_level = base_level ± (volatility_ratio - 1) × 20
Bounds levels between practical ranges (15-35 for oversold, 65-85 for overbought)
Purpose: Adjusts RSI sensitivity based on current market volatility conditions rather than using fixed 70/30 levels.
3. Trend Bias Integration
Uses Simple Moving Average slope analysis over configurable period
Calculates trend strength: |slope / price| × 100
Provides visual background shading for trend context
Filters RSI signals based on underlying price trend direction
4. Signal Generation Logic
Entry Conditions:
Bullish: RSI crosses above adaptive oversold level
Bearish: RSI crosses below adaptive overbought level
Strong signals: Include trend bias confirmation
Enhancement over standard RSI: Reduces false signals in choppy markets by requiring trend alignment for "strong" signals.
5. Divergence Detection
Automated identification of regular bullish/bearish divergences
Uses 5-bar lookback for pivot detection
Compares price highs/lows with corresponding RSI highs/lows
Plots divergence markers when conditions are met
Key Features
Real-time adaptive levels based on volatility
Trend-filtered signals to improve reliability
Built-in divergence scanner
Information dashboard showing current values
Comprehensive alert system
Clean visual presentation with customizable colors
Usage Guidelines
This indicator works best when:
Combined with proper risk management
Used in conjunction with other technical analysis
Applied to liquid markets with sufficient volatility data
Configured appropriately for the selected timeframe
Input Parameters
RSI Period: Standard RSI calculation length (default: 14)
Smoothing Period: WMA smoothing for noise reduction (default: 3)
Volatility Lookback: Period for ATR volatility calculation (default: 50)
Base OB/OS Levels: Starting points for adaptive adjustment (70/30)
Trend Period: Moving average length for trend bias (default: 21)
Alert Conditions
Bullish Signal: RSI crosses above adaptive oversold
Bearish Signal: RSI crosses below adaptive overbought
Strong Bullish/Bearish: Signals with trend confirmation
Divergence Alerts: Automated divergence detection
Educational Value
This indicator demonstrates several advanced Pine Script concepts:
Dynamic level calculation using mathematical formulas
Multi-timeframe analysis integration
Conditional signal filtering based on market state
Table display for real-time information
Comprehensive alert system implementation
Limitations
Requires sufficient historical data for volatility calculations
May generate fewer signals in very low volatility environments
Trend bias effectiveness depends on selected MA period
Divergences may not always lead to immediate reversals
Disclaimer
This indicator is for educational and analysis purposes. Past performance does not guarantee future results. Always use proper risk management and consider multiple forms of analysis before making trading decisions.
Script protetto
Questo script è pubblicato come codice protetto. Tuttavia, è possibile utilizzarle liberamente e senza alcuna limitazione – ulteriori informazioni qui.
Declinazione di responsabilità
Le informazioni e le pubblicazioni non sono intese come, e non costituiscono, consulenza o raccomandazioni finanziarie, di investimento, di trading o di altro tipo fornite o approvate da TradingView. Per ulteriori informazioni, consultare i Termini di utilizzo.