OPEN-SOURCE SCRIPT
Aggiornato Exertion Meter
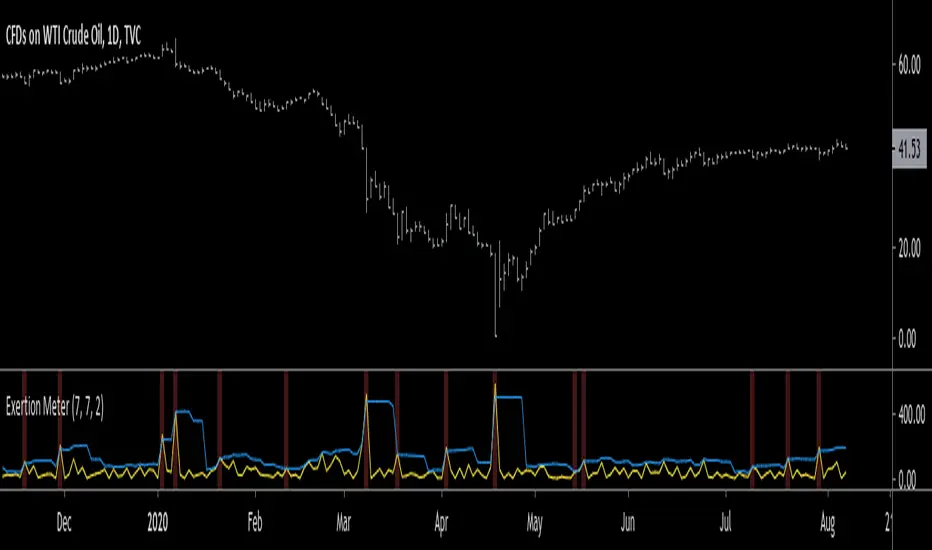
Hello traders, today I wanted to present you something special. I present you the Exertion Meter!
Created from scratch, this idea is based on a theory of mine called "Exertion".
Exertion occurs when price moves beyond the previous bar's range thus it has "exerted itself".
The idea is that when price moves a lot, it exerts a lot of energy which eventually leads to calmer motion, usually in the direction price has exerted itself.
Now, when price has exerted itself a lot in a particular direction, it's telling you that it will likely continue in that direction.
Once this happens, it will gradually calm down until price begins the cycle again, exerting itself in either the same or opposite direction.
This theory is similar to the theory of expansion & contraction phases.
This indicator attempts to show you where price has exerted itself by giving you a two lines cross signal.
The default settings are recommended, but experimentation is encouraged to fit your own personal system.
Both settings control the standard deviation line ( aka . Upper Bollinger Band ).
Enjoy, and hit the follow button to get easy access to all my indicators and to follow my latest publications!
Note di rilascio
Changed colors of standard deviation line (red > blue)Note di rilascio
Added a third parameter: (Line 1 Length)Note di rilascio
Added background colors to show when signal occurs :)Note di rilascio
changed background color.red to na.Script open-source
Nello spirito di TradingView, l'autore di questo script lo ha reso open source, in modo che i trader possano esaminarne e verificarne la funzionalità. Complimenti all'autore! Sebbene sia possibile utilizzarlo gratuitamente, ricordiamo che la ripubblicazione del codice è soggetta al nostro Regolamento.
Declinazione di responsabilità
Le informazioni e le pubblicazioni non sono intese come, e non costituiscono, consulenza o raccomandazioni finanziarie, di investimento, di trading o di altro tipo fornite o approvate da TradingView. Per ulteriori informazioni, consultare i Termini di utilizzo.
Script open-source
Nello spirito di TradingView, l'autore di questo script lo ha reso open source, in modo che i trader possano esaminarne e verificarne la funzionalità. Complimenti all'autore! Sebbene sia possibile utilizzarlo gratuitamente, ricordiamo che la ripubblicazione del codice è soggetta al nostro Regolamento.
Declinazione di responsabilità
Le informazioni e le pubblicazioni non sono intese come, e non costituiscono, consulenza o raccomandazioni finanziarie, di investimento, di trading o di altro tipo fornite o approvate da TradingView. Per ulteriori informazioni, consultare i Termini di utilizzo.