OPEN-SOURCE SCRIPT
Aggiornato COT-index range

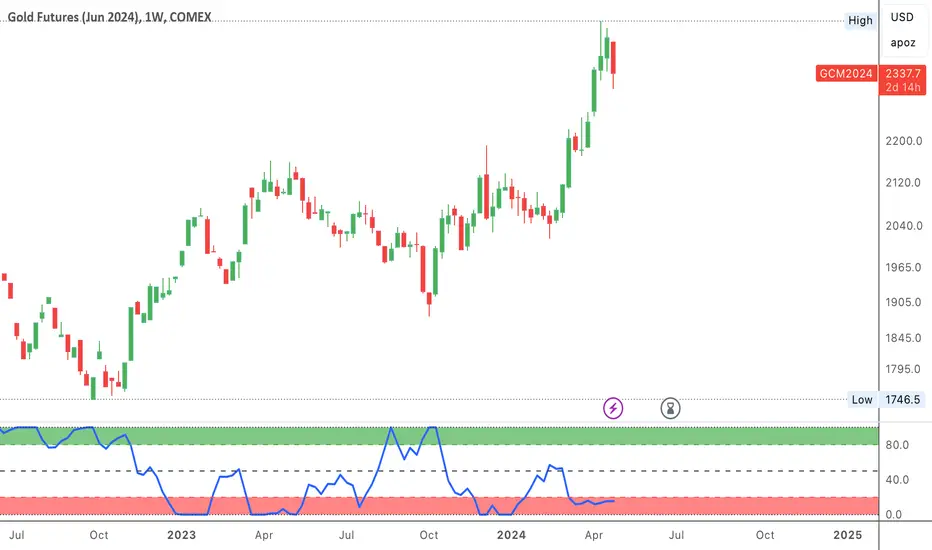
A graph showing the commercials (part of COT-data) positioning in relation to its own range, X periods back. I usually choose the look-back period to equal approximately one year. This will be around 52 on a weekly chart and 250 on a daily chart.
In my opinion a high data-point for the commercials is bullish and vice versa. But instead of only looking att absolute values I now look more at how the commercials are positioned compared to the previous 12 och 6 months.
Example:
a) if COT-index range = 0.8, then the commercials are in the 80th percentile for this specific look-back period, i.e. the commercials has only been more bullish 20% of the time and more bearish 80% of the time.
b) a) if COT-index range = 0.5, then the commercials are in the 50th percentile for this specific look-back period, i.e. the commercials has been more bullish 50% of the time and more bearish 50% of the time.
c) if COT-index range = 0.2, then the commercials are in the 20th percentile for this specific look-back period, i.e. the commercials has been more bullish 80% of the time and more bearish 20% of the time.
In other words, a high reading is bullish and a low reading is bearish.
Note di rilascio
Updated versionNote di rilascio
*Updated*Script showing positioning as reported by the commitment of traders (COT) report, as before.
Whats updated:
1. COT Index
- The COT index shows the net commercial positioning, relative to its own range the last x periods. A high value (default: >80 in a 24 week period) indicates that the net commercials are accumulating long positions. <20 has the same interpretation, but for short positions.
The COT index can basically be interpreted as a percentile, where 100 is the longest, and 0 is the shortest, net positioning the commercials has had for the given period (default 24 weeks).
Note di rilascio
*Updated the default settings*- Note that most lines has to be unticked in order to properly display the COT Index.
Note di rilascio
*Updated defaults and visuals*- All COT data lines, not used to interpret the COT Index, are not displayed by default.
- Color opacity is lowered for the COT Index zones.
Script open-source
Nello spirito di TradingView, l'autore di questo script lo ha reso open source, in modo che i trader possano esaminarne e verificarne la funzionalità. Complimenti all'autore! Sebbene sia possibile utilizzarlo gratuitamente, ricordiamo che la ripubblicazione del codice è soggetta al nostro Regolamento.
Declinazione di responsabilità
Le informazioni e le pubblicazioni non sono intese come, e non costituiscono, consulenza o raccomandazioni finanziarie, di investimento, di trading o di altro tipo fornite o approvate da TradingView. Per ulteriori informazioni, consultare i Termini di utilizzo.