OPEN-SOURCE SCRIPT
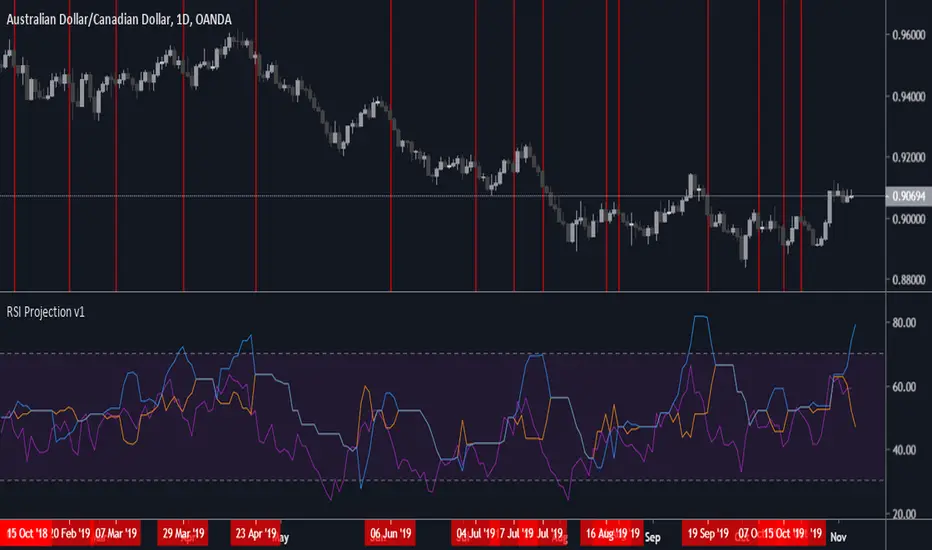
RSI Projection v1
Application of concepts from Constance Brown "Technical Analysis for Trading Professionals", specifically: Chapter 7: Price Projections By Reverse Engineering Indicators, and Chapter 8: Price Objectives Derived From Positive and Negative Reversals In The RSI.
Specifically: I wanted to see if better Exit signals for the RSI could be generated from a basic application of some of the concepts in those chapters, and that is what I've found so far:
Specifically: I wanted to see if better Exit signals for the RSI could be generated from a basic application of some of the concepts in those chapters, and that is what I've found so far:
- Exit when the RSI (purple) crosses below the orange line
- Orange line is forecasted RSI for positive price reversals, blue line is forecasted RSI for negative price reversals
- From what I can tell, this indicator does not work well during chop/consolidation and ranging periods, generating too many false signals without additional confluence from trending indicators and price analysis
- This indicator should be considered highly experimental - do not use live trading without proper backtesting and parameter adjustment.
- Tuning per asset and timeframe is required due to calculation type for highs/lows used for projection calculations
Script open-source
Nello spirito di TradingView, l'autore di questo script lo ha reso open source, in modo che i trader possano esaminarne e verificarne la funzionalità. Complimenti all'autore! Sebbene sia possibile utilizzarlo gratuitamente, ricordiamo che la ripubblicazione del codice è soggetta al nostro Regolamento.
Declinazione di responsabilità
Le informazioni e le pubblicazioni non sono intese come, e non costituiscono, consulenza o raccomandazioni finanziarie, di investimento, di trading o di altro tipo fornite o approvate da TradingView. Per ulteriori informazioni, consultare i Termini di utilizzo.