OPEN-SOURCE SCRIPT
Aggiornato Multi-Timeframe EMA Tracker by Ox_kali

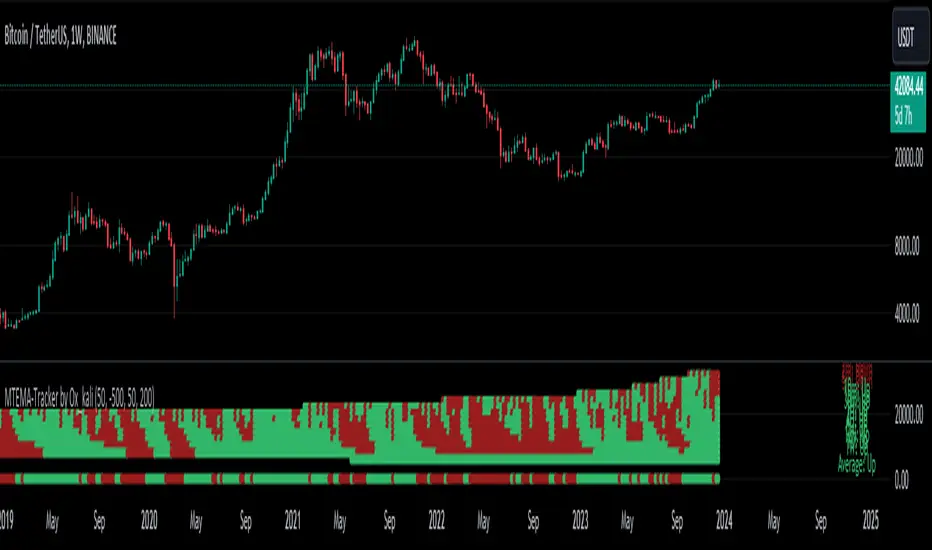
This script is an advanced trend analysis indicator crafted for traders who seek a detailed and customizable view of market trends across multiple timeframes. This tool utilizes exponential moving averages (EMAs) to offer insights into market direction and momentum.
Key Features:
List of Parameters:
Indicators and Financial Name Label settings: To ensure maximum clarity and understanding of the displayed trends, users should not hesitate to use the function to display "indicators and financial name labels" in their settings. This feature will help in identifying the legends for each trend, making it easier to interpret the market direction for the selected timeframes.
Please note that the MTEMA-Tracker is not a guarantee of future market performance and should be used in conjunction with proper risk management. Always ensure that you have a thorough understanding of the indicator’s methodology and its limitations before making any investment decisions. Additionally, past performance is not indicative of future results.
Key Features:
- Multi-Timeframe Analysis: MTEMA-Tracker covers a wide range of timeframes, including 1, 2, 3, 5, 10, 15, 30 minutes; 1, 2, 4, 6, 12 hours; 1 day; and 1 week. This allows traders to analyze market trends from various perspectives, from short-term fluctuations to longer-term movements.
- EMA-Based Trend Determination: The indicator employs two EMAs (50 and 200 periods) for each timeframe to ascertain the market trend. A higher EMA50 compared to EMA200 indicates an uptrend, while the opposite scenario suggests a downtrend.
- User-Defined Trend Colors: Traders can personalize the appearance of the trend lines with custom colors for upward and downward trends, enhancing visual clarity and quick interpretation.
- Selectable Timeframe Display: MTEMA-Tracker by Ox_kali offers the flexibility to choose which timeframes to display, enabling traders to focus on the most relevant data for their trading strategy.
- Average Trend Calculation: A unique feature of MTEMA-Tracker is its ability to compute the average trend across all selected timeframes, providing a holistic view of the market's general direction.
List of Parameters:
- Color of the trend: Customizable color settings for both upward and downward trends.
- Settings for the Lengths of the EMAs: Options to set the lengths of the short and long-term EMAs.
- Display Options for Each Timeframe's EMA Trend: Ability to activate or deactivate the display of EMAs for each selected timeframe.
Indicators and Financial Name Label settings: To ensure maximum clarity and understanding of the displayed trends, users should not hesitate to use the function to display "indicators and financial name labels" in their settings. This feature will help in identifying the legends for each trend, making it easier to interpret the market direction for the selected timeframes.
Please note that the MTEMA-Tracker is not a guarantee of future market performance and should be used in conjunction with proper risk management. Always ensure that you have a thorough understanding of the indicator’s methodology and its limitations before making any investment decisions. Additionally, past performance is not indicative of future results.
Note di rilascio
Update NoteModifications:
Label and Variable Declaration:
- Added label variables (tf1 to tf15) for storing references to various timeframe labels.
- Introduced bool variables (MinValue_1 to WeekValue_1) to represent the trend direction for each timeframe.
Trend Direction Logic:
- Implemented logic to determine the trend direction (Up or Down) for each timeframe based on the comparison between ema50 and ema200. This covers timeframes from 1 minute to 1 week.
Label Creation and Update:
- Utilized the createOrUpdateLabel function to dynamically create or update labels for each timeframe, indicating the trend direction.
Average Trend Calculation:
- Added a new calculation for determining the average trend across all timeframes, based on the counts of greenCount (upwards trends) and redCount (downwards trends).
- Implemented a new label (tf15) for displaying the overall average trend as either Up or Down, depending on whether greenCount is greater than redCount.
Miscellaneous Enhancements:
- Ensured that all variables are reset at the beginning of a new bar to maintain accurate trend analysis.
- Improved code readability and organization through consistent commenting and structure.
Objective:
- These enhancements aim to provide a more comprehensive and dynamic analysis of trend directions across multiple timeframes, culminating in an overall average trend assessment.
- The update facilitates easier visualization of trends and timeframe.
Note di rilascio
update color modes and user inputs for colorsScript open-source
Nello spirito di TradingView, l'autore di questo script lo ha reso open source, in modo che i trader possano esaminarne e verificarne la funzionalità. Complimenti all'autore! Sebbene sia possibile utilizzarlo gratuitamente, ricordiamo che la ripubblicazione del codice è soggetta al nostro Regolamento.
Declinazione di responsabilità
Le informazioni e le pubblicazioni non sono intese come, e non costituiscono, consulenza o raccomandazioni finanziarie, di investimento, di trading o di altro tipo fornite o approvate da TradingView. Per ulteriori informazioni, consultare i Termini di utilizzo.
Script open-source
Nello spirito di TradingView, l'autore di questo script lo ha reso open source, in modo che i trader possano esaminarne e verificarne la funzionalità. Complimenti all'autore! Sebbene sia possibile utilizzarlo gratuitamente, ricordiamo che la ripubblicazione del codice è soggetta al nostro Regolamento.
Declinazione di responsabilità
Le informazioni e le pubblicazioni non sono intese come, e non costituiscono, consulenza o raccomandazioni finanziarie, di investimento, di trading o di altro tipo fornite o approvate da TradingView. Per ulteriori informazioni, consultare i Termini di utilizzo.