OPEN-SOURCE SCRIPT
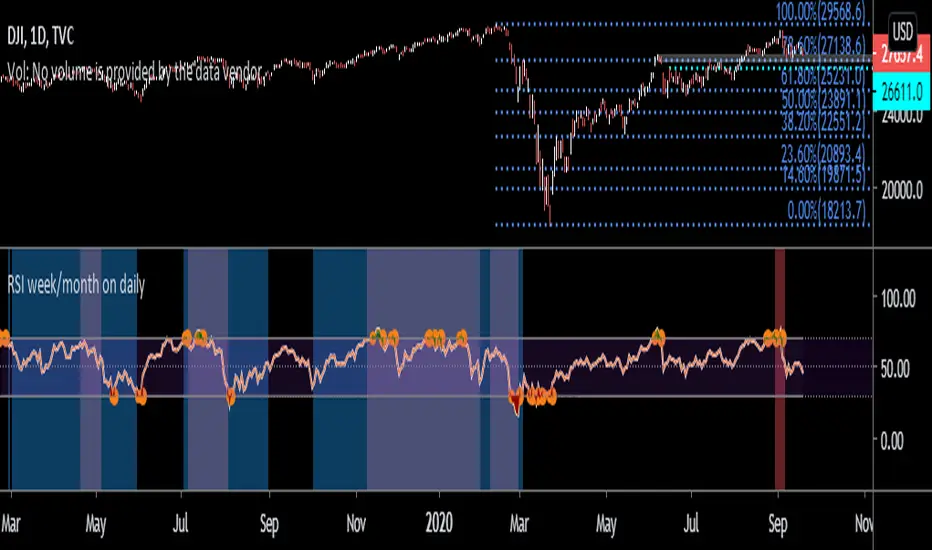
RSI week/month level on daily Time frame

- You can analyse the trend strength on daily time frame by looking of weekly and monthly is greater than 60.
- Divergence code is taken from tradingview's Divergence Indicator code.
#Strategy 1 : BUY ON DIPS
- This will help in identifying bullish zone of the price when RSI on DAILY, WEEKLY and Monthly is >60
-Take a trade when monthly and weekly rsi is >60 but daily RSI is less thaN 40.
- Divergence code is taken from tradingview's Divergence Indicator code.
#Strategy 1 : BUY ON DIPS
- This will help in identifying bullish zone of the price when RSI on DAILY, WEEKLY and Monthly is >60
-Take a trade when monthly and weekly rsi is >60 but daily RSI is less thaN 40.
Script open-source
Nello spirito di TradingView, l'autore di questo script lo ha reso open source, in modo che i trader possano esaminarne e verificarne la funzionalità. Complimenti all'autore! Sebbene sia possibile utilizzarlo gratuitamente, ricordiamo che la ripubblicazione del codice è soggetta al nostro Regolamento.
Declinazione di responsabilità
Le informazioni e le pubblicazioni non sono intese come, e non costituiscono, consulenza o raccomandazioni finanziarie, di investimento, di trading o di altro tipo fornite o approvate da TradingView. Per ulteriori informazioni, consultare i Termini di utilizzo.