OPEN-SOURCE SCRIPT
Zero Lag MTF Moving Average by CoffeeshopCrypto
Based on Moving Average Types supplied by TradingView tradingview.com/support/solutions/43000696841/
Ideas and code enhanced to show higher timeframe by CoffeeshopCrypto
It’s time to take the guesswork out of moving averages and multiple timeframes when day trading. Moving averages are a cornerstone of many trading strategies, often viewed as dynamic support and resistance levels. Traders rely on these levels to anticipate price reactions, whether it’s a bounce in a trending market or a reversal in a ranging one. Additionally, the direction and alignment of multi timeframe moving averages—whether they’re moving in the same direction or diverging—provide critical clues about market momentum and potential reversals. However, the traditional higher timeframe moving average indicators force traders to wait for higher timeframe candles to close, creating lag and missed opportunities.

The Old Way
For example: If you are on a 5 minute chart and you want to observe the location and direction of a 30 minute chart Moving Average, you'll need to wait for a total of 6 candles to close, and again every 6 candles after that. This only creates more lag.

The New Way
Now there is no waiting for high timeframe session candles to close. No matter what timeframe Moving Average you want to know about, this indicator will show you its location on your current chart at any time in real time.

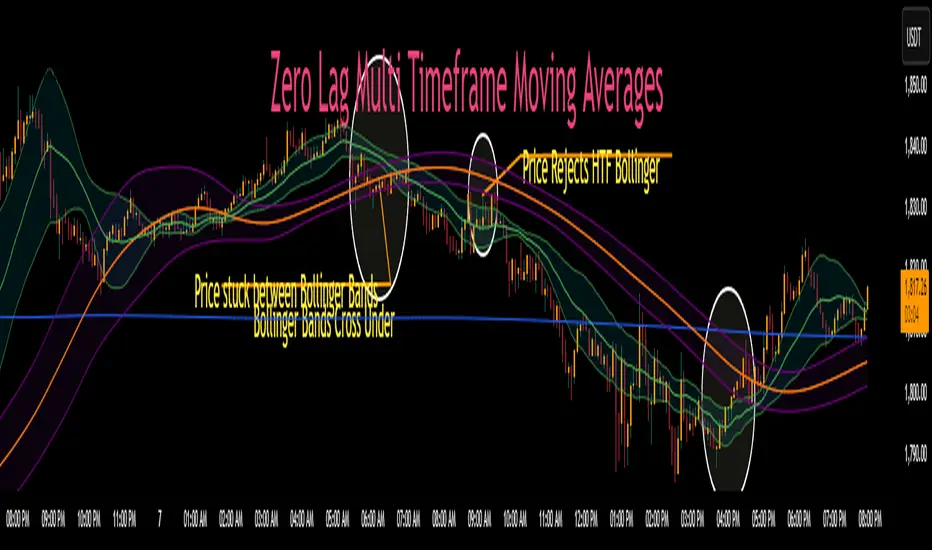
For those who prefer Bollinger Bands, this indicator adds a whole new dimension to your strategy. Traders often wait for price action to break outside the lower time frame Bollinger bands before considering a trade, while still seeking key support or resistance levels beyond them. But if you don't know the position of your higher time frame Bollinger, you could be trading into a trap. With Zero Lag Multi Timeframe Moving Average, you can view both your current and higher timeframe Bollinger Bands simultaneously with zero waiting. This lets you instantly see when price action is traveling between the bands of either timeframe or breaking through both—indicating a strong trend in that direction. Additionally, when both sets of Bollinger Bands overlap at the same price levels, it highlights areas of strong consolidation and ranging conditions, giving you a clear picture of market dynamics. This is a key element in price action that tells you there is currently no direction to the market and both the current and higher time frames are flat.
Enter Zero Lag Multi Timeframe Moving Average—the ultimate tool for real-time higher timeframe moving averages and Bollinger Bands. This innovative indicator eliminates the delay, delivering instant, precise values for higher timeframe averages and bands, even on open candles. Seamlessly combining current and higher timeframe data, it allows traders to identify key moments where moving averages or Bollinger Bands align or diverge, signaling market conditions. Whether you’re gauging the strength of a trend, pinpointing potential reversals, or identifying consolidation zones, Zero Lag Multi Timeframe Moving Average gives you the clarity needed to make better trading decisions according to market conditions.
Why is this "Mashup" of moving averages different and important?
Honestly its really about the calculation thats imported through the "import library" function.
Heres what it does:
The ZLMTF-MA is designed to help traders easily see where higher timeframe moving averages and Bollinger Bands are—without needing to switch chart timeframes or wait for those larger candles to close. It works by adjusting common moving average types like SMA, EMA, and VWMA to show what they would look like if they were based on a higher timeframe, right on your current chart. This helps users stay focused on their main timeframe while still having a clear view of the bigger picture, making it easier to spot trend direction, key support and resistance levels, and overall market structure. The goal is to keep things simple, fast, and more visually informative for everyday traders.

Bollinger Bands
When working with Bollinger Bands, a common strategy is to take the trades once price action has escaped through the top or bottom of your current Bollinger Band.
A false breakout occurs when both Bollinger Bands are not moving in the same direction as eachother or when they are overlapping.

Moving Averages as Support and Resistance:
Traders who use Moving Averages as support or resistance, looking for rejections or failures of these areas can now see multiple timeframe price action instantly and simultaneously.
Trading Setup Examples:
Price Action Scenario 1:
Higher Timeframe Ranging-
When price action breaks through a current moving average headed toward a higher timeframe moving average, trades are taken with caution if the moving averages are converging.
Price Action Scenario 2:
Strong Trending Market -
If the moving averages are in the same direction, and your price action is now leading the low timeframe moving average, you have re-entered a strong trend.
Price Action Scenario 3:
High Timeframe Rejections -
If you have a rejection of a higher timeframe moving average, and your both averages are still diverging, this is the end of a pullback as you re-enter a strong trend in the original direction
Price Action Scenario 4:
Trend Reversals -
If you close beyond both the low and high timeframe moving averages, you can consider that price action is strong enough to change direction here and you should prepare for trade setups in the opposite direction of the previous.

HTF MA Label Information:
Even if your high timeframe moving average is turned off, you can still see this label.
It gives you a quick reminder of what high timeframe settings you have used to see MA values.
Ideas and code enhanced to show higher timeframe by CoffeeshopCrypto
It’s time to take the guesswork out of moving averages and multiple timeframes when day trading. Moving averages are a cornerstone of many trading strategies, often viewed as dynamic support and resistance levels. Traders rely on these levels to anticipate price reactions, whether it’s a bounce in a trending market or a reversal in a ranging one. Additionally, the direction and alignment of multi timeframe moving averages—whether they’re moving in the same direction or diverging—provide critical clues about market momentum and potential reversals. However, the traditional higher timeframe moving average indicators force traders to wait for higher timeframe candles to close, creating lag and missed opportunities.
The Old Way
For example: If you are on a 5 minute chart and you want to observe the location and direction of a 30 minute chart Moving Average, you'll need to wait for a total of 6 candles to close, and again every 6 candles after that. This only creates more lag.
The New Way
Now there is no waiting for high timeframe session candles to close. No matter what timeframe Moving Average you want to know about, this indicator will show you its location on your current chart at any time in real time.
For those who prefer Bollinger Bands, this indicator adds a whole new dimension to your strategy. Traders often wait for price action to break outside the lower time frame Bollinger bands before considering a trade, while still seeking key support or resistance levels beyond them. But if you don't know the position of your higher time frame Bollinger, you could be trading into a trap. With Zero Lag Multi Timeframe Moving Average, you can view both your current and higher timeframe Bollinger Bands simultaneously with zero waiting. This lets you instantly see when price action is traveling between the bands of either timeframe or breaking through both—indicating a strong trend in that direction. Additionally, when both sets of Bollinger Bands overlap at the same price levels, it highlights areas of strong consolidation and ranging conditions, giving you a clear picture of market dynamics. This is a key element in price action that tells you there is currently no direction to the market and both the current and higher time frames are flat.
Enter Zero Lag Multi Timeframe Moving Average—the ultimate tool for real-time higher timeframe moving averages and Bollinger Bands. This innovative indicator eliminates the delay, delivering instant, precise values for higher timeframe averages and bands, even on open candles. Seamlessly combining current and higher timeframe data, it allows traders to identify key moments where moving averages or Bollinger Bands align or diverge, signaling market conditions. Whether you’re gauging the strength of a trend, pinpointing potential reversals, or identifying consolidation zones, Zero Lag Multi Timeframe Moving Average gives you the clarity needed to make better trading decisions according to market conditions.
Why is this "Mashup" of moving averages different and important?
Honestly its really about the calculation thats imported through the "import library" function.
Heres what it does:
The ZLMTF-MA is designed to help traders easily see where higher timeframe moving averages and Bollinger Bands are—without needing to switch chart timeframes or wait for those larger candles to close. It works by adjusting common moving average types like SMA, EMA, and VWMA to show what they would look like if they were based on a higher timeframe, right on your current chart. This helps users stay focused on their main timeframe while still having a clear view of the bigger picture, making it easier to spot trend direction, key support and resistance levels, and overall market structure. The goal is to keep things simple, fast, and more visually informative for everyday traders.
Bollinger Bands
When working with Bollinger Bands, a common strategy is to take the trades once price action has escaped through the top or bottom of your current Bollinger Band.
A false breakout occurs when both Bollinger Bands are not moving in the same direction as eachother or when they are overlapping.
Moving Averages as Support and Resistance:
Traders who use Moving Averages as support or resistance, looking for rejections or failures of these areas can now see multiple timeframe price action instantly and simultaneously.
Trading Setup Examples:
Price Action Scenario 1:
Higher Timeframe Ranging-
When price action breaks through a current moving average headed toward a higher timeframe moving average, trades are taken with caution if the moving averages are converging.
Price Action Scenario 2:
Strong Trending Market -
If the moving averages are in the same direction, and your price action is now leading the low timeframe moving average, you have re-entered a strong trend.
Price Action Scenario 3:
High Timeframe Rejections -
If you have a rejection of a higher timeframe moving average, and your both averages are still diverging, this is the end of a pullback as you re-enter a strong trend in the original direction
Price Action Scenario 4:
Trend Reversals -
If you close beyond both the low and high timeframe moving averages, you can consider that price action is strong enough to change direction here and you should prepare for trade setups in the opposite direction of the previous.
HTF MA Label Information:
Even if your high timeframe moving average is turned off, you can still see this label.
It gives you a quick reminder of what high timeframe settings you have used to see MA values.
Script open-source
Nello spirito di TradingView, l'autore di questo script lo ha reso open source, in modo che i trader possano esaminarne e verificarne la funzionalità. Complimenti all'autore! Sebbene sia possibile utilizzarlo gratuitamente, ricordiamo che la ripubblicazione del codice è soggetta al nostro Regolamento.
Discord = discord.gg/EAncX5TpfB
coffeeshopcrypto3@gmail.com
coffeeshopcrypto3@gmail.com
Declinazione di responsabilità
Le informazioni e le pubblicazioni non sono intese come, e non costituiscono, consulenza o raccomandazioni finanziarie, di investimento, di trading o di altro tipo fornite o approvate da TradingView. Per ulteriori informazioni, consultare i Termini di utilizzo.