OPEN-SOURCE SCRIPT
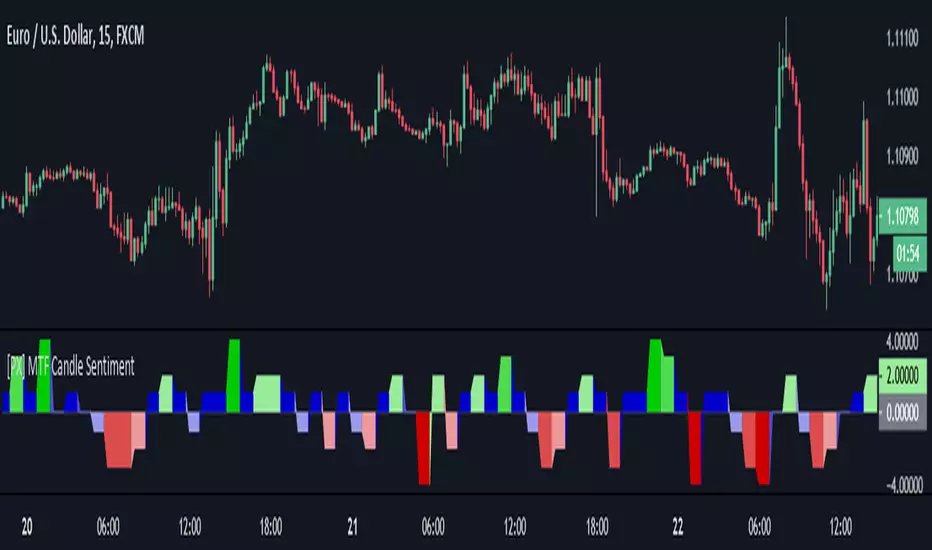
[PX] MTF Candle Sentiment

This indicator calculates the candlestick sentiment for the selected timeframe. The calculation consists of two steps:
Those two steps create 9 possible scores, which will determine the color of the graph.
If you are looking for someone to develop your own indicator or trading strategy, don't hesitate to get in touch with me here on TradingView or below.
Contact:
pascal-simon.de
info@pascal-simon.de
- Step 1: Positioning of the closing price:
Upper Third = High Close
Mid Third = Mid Close
Lower Third = Low Close - Step 2: Positioning of the closing price in comparison to its previous candle:
Close above the high of the previous candle = Bull candle
Close within the range of the previous candle = Range candle
Close below the low of the previous candle = Bear candle
Those two steps create 9 possible scores, which will determine the color of the graph.
If you are looking for someone to develop your own indicator or trading strategy, don't hesitate to get in touch with me here on TradingView or below.
Contact:
pascal-simon.de
info@pascal-simon.de
Script open-source
Nello spirito di TradingView, l'autore di questo script lo ha reso open source, in modo che i trader possano esaminarne e verificarne la funzionalità. Complimenti all'autore! Sebbene sia possibile utilizzarlo gratuitamente, ricordiamo che la ripubblicazione del codice è soggetta al nostro Regolamento.
🙋♂️Listed as "Trusted Pine Programmer for Hire"
💰Save $30 on your Tradingview subscription: bit.ly/3OtLyNz
🔓Indicator access: dize-trading.de/
🔒Trial access: discord.gg/DqwKjBZ8Qe
💰Save $30 on your Tradingview subscription: bit.ly/3OtLyNz
🔓Indicator access: dize-trading.de/
🔒Trial access: discord.gg/DqwKjBZ8Qe
Declinazione di responsabilità
Le informazioni e le pubblicazioni non sono intese come, e non costituiscono, consulenza o raccomandazioni finanziarie, di investimento, di trading o di altro tipo fornite o approvate da TradingView. Per ulteriori informazioni, consultare i Termini di utilizzo.