PINE LIBRARY
TimeSeriesRecurrencePlot
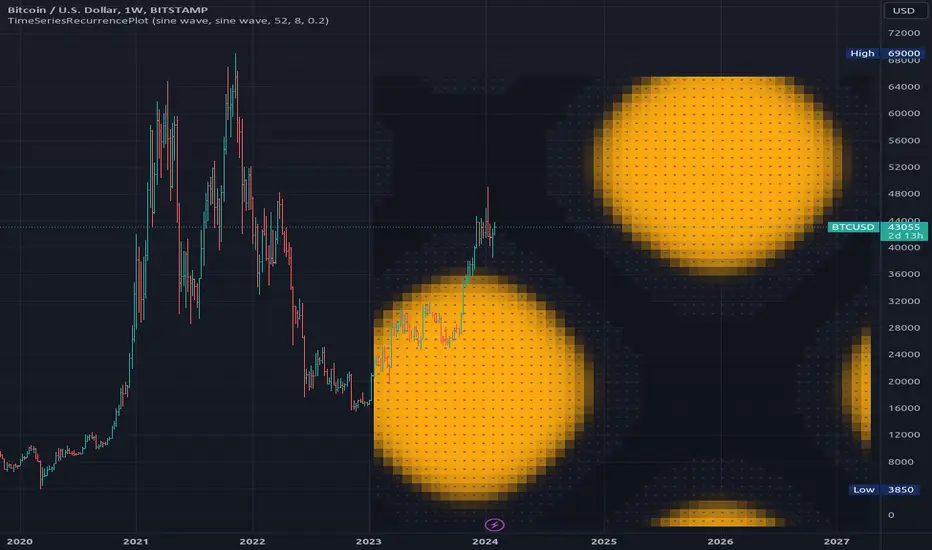
Library "TimeSeriesRecurrencePlot"
In descriptive statistics and chaos theory, a recurrence plot (RP) is a plot showing, for each moment i i in time, the times at which the state of a dynamical system returns to the previous state at `i`, i.e., when the phase space trajectory visits roughly the same area in the phase space as at time `j`.
```
A recurrence plot (RP) is a graphical representation used in the analysis of time series data and dynamical systems. It visualizes recurring states or events over time by transforming the original time series into a binary matrix, where each element represents whether two consecutive points are above or below a specified threshold. The resulting Recurrence Plot Matrix reveals patterns, structures, and correlations within the data while providing insights into underlying mechanisms of complex systems.
```
~starling7b
___
Reference:
en.wikipedia.org/wiki/Recurrence_plot
github.com/johannfaouzi/pyts/blob/main/pyts/image/recurrence.py
github.com/bmfreis/recurrence_python/blob/master/cross_recurrence.py
github.com/bmfreis/recurrence_cpp/blob/master/CrossRecurrencePlot.cpp
github.com/JuliaDynamics/RecurrenceAnalysis.jl/blob/main/src/matrices/distance_matrix.jl
juliadynamics.github.io/RecurrenceAnalysis.jl/v2.0/rplots/
distance_matrix(series1, series2, max_freq, norm)
Generate distance matrix between two series.
Parameters:
series1 (float): Source series 1.
series2 (float): Source series 2.
max_freq (int): Maximum frequency to inpect or the size of the generated matrix.
norm (string): Norm of the distance metric, default=`euclidean`, options=`euclidean`, `manhattan`, `max`.
Returns: Matrix with distance values.
method normalize_distance(M)
Normalizes a matrix within its Min-Max range.
Namespace types: matrix<float>
Parameters:
M (matrix<float>): Source matrix.
Returns: Normalized matrix.
method threshold(M, threshold)
Updates the matrix with the condition `M(i,j) > threshold ? 1 : 0`.
Namespace types: matrix<float>
Parameters:
M (matrix<float>): Source matrix.
threshold (float)
Returns: Cross matrix.
rolling_window(a, b, sample_size)
An experimental alternative method to plot a recurrence_plot.
Parameters:
a (array<float>): Array with data.
b (array<float>): Array with data.
sample_size (int)
Returns: Recurrence_plot matrix.
Libreria Pine
Nello spirito di TradingView, l'autore ha pubblicato questo codice Pine come libreria open source affinché altri programmatori della nostra comunità possano riutilizzarlo. Complimenti all'autore! È possibile utilizzare questa libreria privatamente o in altre pubblicazioni open source, ma il riutilizzo di questo codice nelle pubblicazioni è soggetto al Regolamento.
Declinazione di responsabilità
Le informazioni e le pubblicazioni non sono intese come, e non costituiscono, consulenza o raccomandazioni finanziarie, di investimento, di trading o di altro tipo fornite o approvate da TradingView. Per ulteriori informazioni, consultare i Termini di utilizzo.