PROTECTED SOURCE SCRIPT
CNN Fear and Greed Index
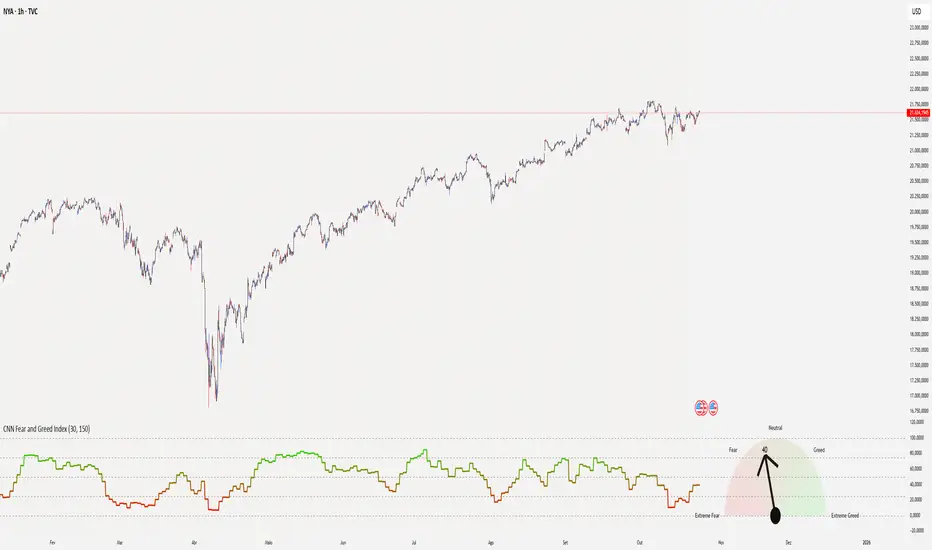
📊 CNN Fear & Greed Index — by victhoreb
Tap into the emotional heartbeat of the U.S. stock market with this powerful CNN-inspired Fear & Greed Index! 🧠📉📈 Designed to mirror the sentiment framework popularized by CNN Business, this indicator blends 7 key market signals into a single score from 0 (😱 Extreme Fear) to 100 (🚀 Extreme Greed), helping you navigate volatility with confidence.
🧩 What’s Inside?
Each component captures a unique behavioral or macroeconomic force:
- ⚡ Market Momentum: Tracks how far the S&P 500 is from its 125-day average — a pulse check on trend strength.
- 🏛️ Stock Price Strength: Measures the NYSE Highs vs. Lows — are more stocks breaking out or breaking down?
- 🌊 Stock Price Breadth: Uses the McClellan Volume Summation Index to assess market-wide participation.
- ☎️ Put/Call Ratio: A 5-day average of the equity options market — are traders hedging or chasing?
- 🌪️ Volatility (VIX): Compares the VIX to its 50-day average — rising fear or calming nerves?
- 🛡️ Safe Haven Demand: Contrasts stock returns with bond returns — are investors seeking shelter or risk?
- 💣 Junk Bond Demand: Inverted high-yield spread — tighter spreads = more risk-on appetite.
🎯 Why Use It?
This index gives you a quantified view of Wall Street’s mood, helping you:
- Spot emotional extremes that often precede reversals
- Confirm or challenge your directional bias
- Stay grounded when the market gets irrational
🧭 Visual Sentiment Meter
A custom offset sentiment meter shows current positioning with intuitive labels:
- 😱 Extreme Fear
- 😨 Fear
- 😐 Neutral
- 😄 Greed
- 🚀 Extreme Greed
Color gradients and dynamic labels make it easy to interpret at a glance.
Ready to trade with the crowd—or against it? Add this indicator to your chart and let sentiment guide your strategy! 📈🧠
Script protetto
Questo script è pubblicato come codice protetto. Tuttavia, è possibile utilizzarle liberamente e senza alcuna limitazione – ulteriori informazioni qui.
Declinazione di responsabilità
Le informazioni e le pubblicazioni non sono intese come, e non costituiscono, consulenza o raccomandazioni finanziarie, di investimento, di trading o di altro tipo fornite o approvate da TradingView. Per ulteriori informazioni, consultare i Termini di utilizzo.