OPEN-SOURCE SCRIPT
Aggiornato Heikin Multi Time Frame
// How it Works \\
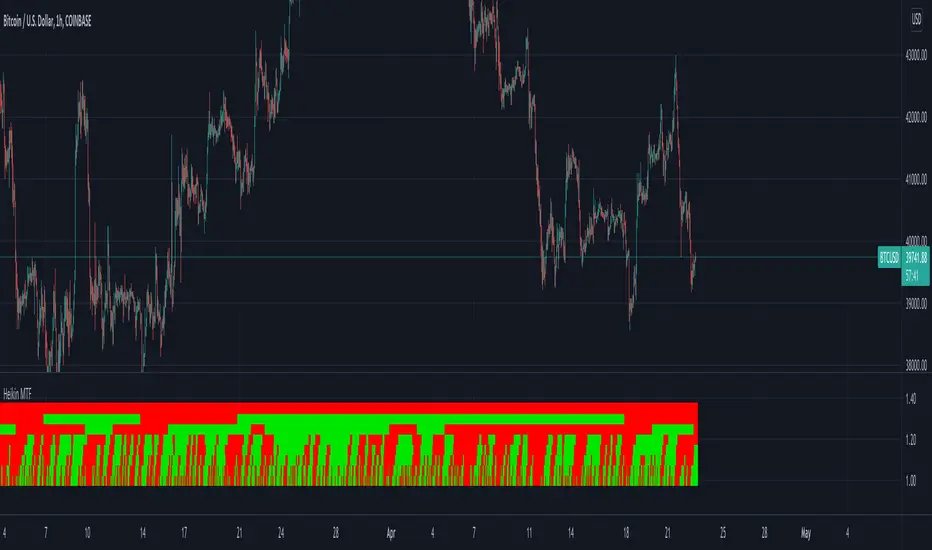
This script calculates the open and close prices of Heikin Ashi candles across multiple timeframes,
If the candle formed on that timeframe is green it will display in the table a green square, If the candle is red, the square will display red.
// Settings \\
You can change the colours of the plots
You can also Change any of the timeframes which the Heikin Ashi candles are being calculated on
// Use Case \\
Heikin Ashi candles are often used to give a smoother trend direction and help cancel out some of the noice/consolidation.
It can also be use as trend detection for multiple timeframes at once
// Suggestions \\
Happy for anyone to make any suggestions on changes which could improve the script,
// Terms \\
Feel free to use the script, If you do use the scrip please just tag me as I am interested to see how people are using it. Good Luck!
Note di rilascio
Minor UpdateJust changed the plotting calculation slightly
Note di rilascio
Added AlertsScript open-source
Nello spirito di TradingView, l'autore di questo script lo ha reso open source, in modo che i trader possano esaminarne e verificarne la funzionalità. Complimenti all'autore! Sebbene sia possibile utilizzarlo gratuitamente, ricordiamo che la ripubblicazione del codice è soggetta al nostro Regolamento.
Declinazione di responsabilità
Le informazioni e le pubblicazioni non sono intese come, e non costituiscono, consulenza o raccomandazioni finanziarie, di investimento, di trading o di altro tipo fornite o approvate da TradingView. Per ulteriori informazioni, consultare i Termini di utilizzo.
Script open-source
Nello spirito di TradingView, l'autore di questo script lo ha reso open source, in modo che i trader possano esaminarne e verificarne la funzionalità. Complimenti all'autore! Sebbene sia possibile utilizzarlo gratuitamente, ricordiamo che la ripubblicazione del codice è soggetta al nostro Regolamento.
Declinazione di responsabilità
Le informazioni e le pubblicazioni non sono intese come, e non costituiscono, consulenza o raccomandazioni finanziarie, di investimento, di trading o di altro tipo fornite o approvate da TradingView. Per ulteriori informazioni, consultare i Termini di utilizzo.