OPEN-SOURCE SCRIPT
Aggiornato RSI Triple Time Frame

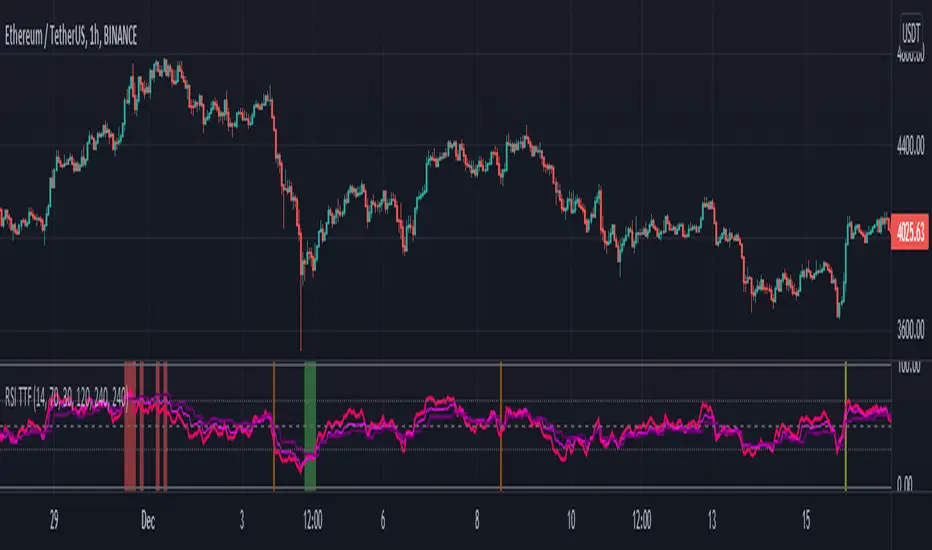
This indicator / study script can display the RSI for current chart timeframe along with the RSI of 1 to 3 other timeframes.
When all 3 additional RSI are at extreme levels (overbought/sold) or crossing the neutral line (50%) at the same moment, background chart color will change accordingly.
This indicates a strong momentum convergence between all selected timeframes, hence producing a stronger signal!
Go to settings to display/modify additional timeframes and/or to enable background colors:
Green = Overbought
Red = Oversold
Yellow = crossover neutral
Orange = crossunder neutral
NB1: For a simple and easy read of the RSI, set all additional TF to current chart TF and switch on desired colors.
NB2: Please note that current chart TF is not taken into consideration to change background color. But you can always set one of the 3 additional TF to the same TF as current chart.
Bonus: If you are also a user of my “MA Bollinger Bands + RSI” strategy script, this is particularly useful to visually detect crossover and crossunder of the RSI neutral line 😉
As always, enjoy!
Note di rilascio
Neutral Line, previsouly hard coded at 50, now has it's own user input.Note di rilascio
- [Upadted to Pine V5]
[Color changes between possible max & min values]
[Cleaner input settings]
Note di rilascio
- Upadted to Pine V5
- Color changes between possible max & min values
- Cleaner input settings
Note di rilascio
V5- Fixed the 3 "Higher Time Frame RSIs" repainting issues.
Script open-source
Nello spirito di TradingView, l'autore di questo script lo ha reso open source, in modo che i trader possano esaminarne e verificarne la funzionalità. Complimenti all'autore! Sebbene sia possibile utilizzarlo gratuitamente, ricordiamo che la ripubblicazione del codice è soggetta al nostro Regolamento.
Declinazione di responsabilità
Le informazioni e le pubblicazioni non sono intese come, e non costituiscono, consulenza o raccomandazioni finanziarie, di investimento, di trading o di altro tipo fornite o approvate da TradingView. Per ulteriori informazioni, consultare i Termini di utilizzo.