OPEN-SOURCE SCRIPT
Bank Nifty Market Breadth (OsMA)
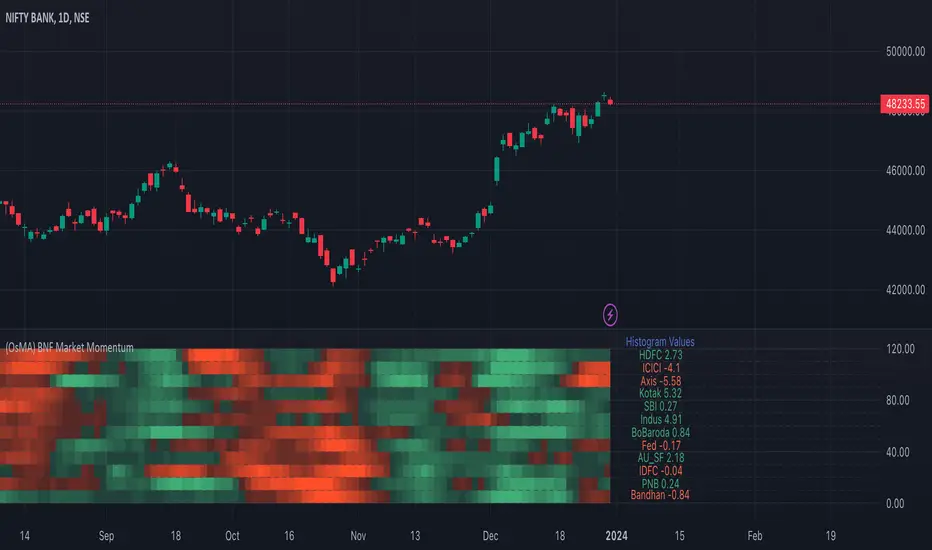
This indicator is the market breadth for Bank Nifty (NSE:BANKNIFTY) index calculated on the histogram values of MACD indicator. Each row in this indicator is a representation of the histogram values of the individual stock that make up Bank Nifty. Components are listed in order of its weightage to Bank nifty index (Highest -> Lowest).
When you see Bank Nifty is on an uptrend on daily timeframe for the past 10 days, you can see what underlying stocks support that uptrend. The brighter the plot colour, the higher the momentum and vice versa. Looking at the individual rows that make up Bank Nifty, you can have an understanding if there is still enough momentum in the underlying stocks to go higher or are there many red plots showing up indicating a possible pullback or trend reversal.
The plot colours are shown as a percentage of the current histogram value taken from MACD from the highest histogram value of the previous 200 bars shown on the current timeframe. Look back value of 200 bars was chosen as it provided a better representation of the current value from its peak over the recent past(previous 200 bars), on all timeframes. Histogram value do grow/fall along with the underlying stock price, so choosing the chart's all-time high/low value as peak was not ideal. Labels on the right show the current histogram value.
Base Code taken from fengyu05's S&P 500 Market Breadth indicator.
Script open-source
Nello spirito di TradingView, l'autore di questo script lo ha reso open source, in modo che i trader possano esaminarne e verificarne la funzionalità. Complimenti all'autore! Sebbene sia possibile utilizzarlo gratuitamente, ricordiamo che la ripubblicazione del codice è soggetta al nostro Regolamento.
Declinazione di responsabilità
Le informazioni e le pubblicazioni non sono intese come, e non costituiscono, consulenza o raccomandazioni finanziarie, di investimento, di trading o di altro tipo fornite o approvate da TradingView. Per ulteriori informazioni, consultare i Termini di utilizzo.