THD ADX The TradersHelpDesk easily identifies whether the DMI+ or DMI- is dominant, plus identifies when the market is trending using the ADX line. Since the ADX is a non-directional indicator, strong trends should show an increasing ADX line. Additionally, whenever the magenta dot is plotted, traders can expect price to retrace. If the ADX is above 70, then a stronger retracement is likely. For more information, click here .
ADX

APEX - ADX/ADXR/DI+/DI- [v1]Average Directional Movement Index – ADX can be used to help measure the overall strength of a trend. The ADX indicator is an average of expanding price range values. The ADX is a component of the Directional Movement System developed by Welles Wilder. This indicator on its own does not give you a direction but instead measure the strength of the trend. In general values above 20 are considered a trending environment above 30 is then a strong trend and above 50 is a very strong trend.
Average Directional Movement Rating is based on the momentum change of the ADX itself. It is calculated by adding two ADX values (the current value and a value n periods back), then dividing by two. This additional smoothing makes than the ADXR slightly less responsive than ADX but helps to avoid noise.
Minus Directional Indicator (-DI) measures the presence of a downtrend and is part of the Average Directional Index (ADX). If -DI is sloping upward, it's a sign that the price downtrend is getting stronger. The Positive Directional Indicator (+DI) is a component of the Average Directional Index (ADX) and is used to measure the presence of an uptrend. When the +DI is sloping upward, it is a signal that the uptrend is getting stronger. In general values above 20 are considered a trending environment above 30 is then a strong trend and above 50 is a very strong trend.
ADX & DI in one lineThis is the standard ADX & DI indicator, but combined in a single line, changing color when a trend changes and changing value when the trend is strong.

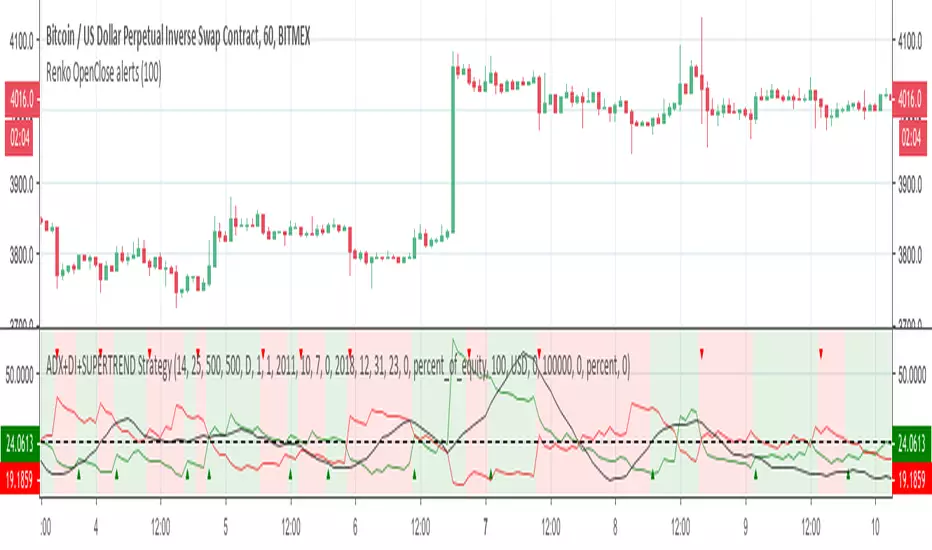
ADX+DI+SUPERTREND StrategyThis strategy is a port of famous script from MasaNakamura ADX and DI.
Here is the exact startegy from original study from MasaNakamura MasaNakamura at
In this version, I added also SUPERTREND as filter!
Scope of this port is to identify corrects inputs to get best results from signals that indicator gives.
I added the possibility to choose stop loss and take profits and to smooth the results also with heikin ashi candles.
Please use comment section for any feedback.
Next improvement (only to whom is interested to this script and follows me): study with alerts on multiple tickers all at one. Leave a comment if you want to have access to study.
********************************** IMPORTANT*******************************
I have developed an expert advisor for metatrader4 (MT4) and for jforex platform: results of expert advisor form 2015-01-01 to 2018-11-25 are very good with low drawdown and good profit.
********************************************************************************
ADX +- DiThis Adx +-Di is just a complete version of what the ADX is supposed to signal.
So you have:
15 (contraction), 20 (threshold), 30 (expansion), 40 (resistance) levels.
Below 20 the price is not trending
Above 30 the price is trending
Below 15 price has been in contraction for too long
Between 20 and 30 price is in a "transition zone".
I finally added a "Resistance" level (40), which has to be adapted to best represent the historical levels where price usually encounters resistance, and where the price can be declared "overtrending", which means a return to lower levels is likely to happen.
I've chosen mild colors, and set the Adx Color to White, because I use black background, you can easily change that.
Enjoy
-Maurice

ADX and DI StrategyThis strategy is a port of famous script from MasaNakamura ADX and DI
Original study from MasaNakamura MasaNakamura at
Scope of this port is to identify corrects inputs to get best results from signals that indicator gives.
I added the possibility to choose stop loss and take profits and to smooth the results also with heikin ashi candles.
Please use comment section for any feedback.
Next improvement (only to whom is interested to this script and follows me): study with alerts on multiple tickers all at one. Leave a comment if you want to have access to study.
********************************** IMPORTANT*******************************
I have developed an expert advisor for metatrader4 (MT4) and for jforex platform: results of expert advisor form 2015-01-01 to 2018-11-25 are very good with low drawdown and good profit.
********************************************************************************

fiercebitraderEl indicador fiercebitrader, es un indicador basado en el Índice Medio de Movimiento Direccional (ADX) es una herramienta de análisis técnico usada para medir la fuerza de la tendencia. El indicador direccional positivo ( DI) y el indicador direccional negativo (-DI) acompañan a la línea ADX. realzando la dirección de la tendencia.
Usados en conjunto forman un sistema de trading que es capaz de determinar tanto la dirección como la fuerza de la tendencia. El indicador consiste en tres líneas: la propia ADX (línea azul), una línea DI (línea verde), y una línea -DI (línea roja). El DI mide la fuerza de la tendencia alcista, mientras que el -DI mide la intensidad del movimiento bajista. La línea ADX muestra la fuerza de la tendencia en general creciendo tanto en las tendencias alcistas como bajistas.
Cuando el DI está por encima del -DI, se dice que los alcistas tienen el dominio direccional. De forma alternativa, cuando el -DI es más alto que el DI, el dominio direccional pertenece a los bajistas.
Es importante entender que el ADX (línea azul) muestra solo la fuerza de la tendencia y no la dirección de la tendencia. La dirección de la tendencia puede en cambio determinarse mirando al DI y el -DI (líneas roja y verde).
¿Cómo usarlo en el trading?
Operar con la tendencia reduce los riesgos e incrementa los beneficios potenciales. Es por esto que muchos traders prefieren consultar la fuerza de la tendencia con ayuda del ADX antes de invertir su dinero. Hay dos formas principales de usar el indicador:
El Cruce de DI
Cuando las líneas direccionales del positivo y negativo se cruzan, normalmente significa que la tendencia está cambiando. Esta información puede usarse para determinar puntos de entrada óptimos. Para los inversores que utilicen este sistema de trading, las señales son las siguientes:
(Compra) cuando el DI cruce el -DI , es mas efectivo, mas fuerte cuando toca o cruza la linea amarilla solida en el nivel de 27 y la tendencia general sea alcista.
El disparo se da en la linea de 20 punteada.
(Venta) cuando el -DI cruce el DI , es mas efectivo, más fuerte cuando toca o cruza la linea amarilla solida en el nivel de 27 y la tendencia sea bajista general sea bajista.
Valor de Fuerza Tendencia ADX
0-20 Tendencia Ausente o Débil
21-26 Disparo
27-50 Tendencia Fuerte
50-75 Tendencia muy Fuerte
75-100 Tendencia Extremadamente Fuerte
El fiercebitrader es un indicador de análisis técnico verdaderamente único, que combinado con otros indicadores, puede convertirse en la estrategia de trading definitiva en manos de un trader.
Recomendado para scalping en temporalidad de 5 min
swing day 1hora. Esta configurado para una operacion optima.
Acompañelo con el indicador bitradertracker.
Con mucho cariño Bitrader4.0
_________________________________
The fiercebitrader indicator, is an indicator based on the Mean Directional Movement Index (ADX) is a technical analysis tool used to measure the strength of the trend. The positive directional indicator (DI) and the negative directional indicator (-DI) accompany the ADX line. enhancing the direction of the trend.
Used together they form a trading system that is able to determine both the direction and strength of the trend. The indicator consists of three lines: the ADX itself (blue line), a DI line (green line), and a -DI line (red line). The DI measures the strength of the uptrend, while the -DI measures the intensity of the bearish movement. The ADX line shows the strength of the overall trend growing in both bullish and bearish trends.
When the DI is above the -DI, it is said that the bulls have the directional domain. Alternatively, when the -DI is higher than the DI, the directional domain belongs to the bears.
It is important to understand that the ADX (blue line) shows only the strength of the trend and not the direction of the trend. The direction of the trend can instead be determined by looking at the DI and the -DI (red and green lines).
How to use it in trading?
Operating with the trend reduces the risks and increases the potential benefits. This is why many traders prefer to consult the strength of the trend with the help of the ADX before investing their money. There are two main ways to use the indicator:
1) The Cross of DI
When the directional lines of the positive and negative intersect, it usually means that the trend is changing. This information can be used to determine optimal entry points. For investors who use this trading system, the signals are the following:
(Buy) when the DI crosses the -DI, it is more effective, stronger when it touches or crosses the solid yellow line at the level of 27 and the general trend is bullish.
The shot is given in the line of 20 dashed.
(Sale) when the -DI crosses the DI, it is more effective, stronger when it touches or crosses the solid yellow line at the level of 27 and the general bearish trend is bearish.
Strength Value ADX Trend
0-20 Absent or Weak Trend
21-26 Shot
27-50 Strong Trend
50-75 Very Strong Trend
75-100 Extremely Strong Trend
The fiercebitrader is a truly unique indicator of technical analysis, which combined with other indicators, can become the definitive trading strategy in the hands of a trader.
Recommended for scalping 5-minute and 1 hour.
It is configured for an optimal operation.
Accompany it with the bitradertracker indicator.
With love Bitrader4.0

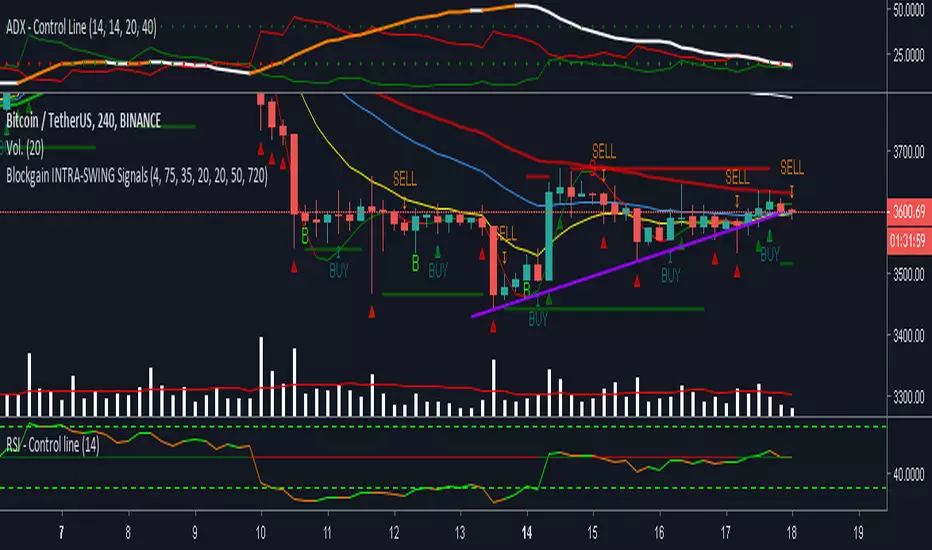
ADX with control lineThis line of control represents, if the ADX is greater than the line of 20, the price trend is considered strong, some people increase it to 25
ADX & DI with Long + Short ConditionsMy version of the ADX & DI Indicator with an extra theshold and adjustable long and short conditions.
A green background (long) will appear when the ADX is rising, the DI+ is falling and the DI+ is below the (new) lower threshold.
A red background (short) will appear when the ADX is rising, the DI- is falling and the DI- is below the (new) lower treshold.
You can adjust the tolerance for the lower threshold in the settings of the indicator.
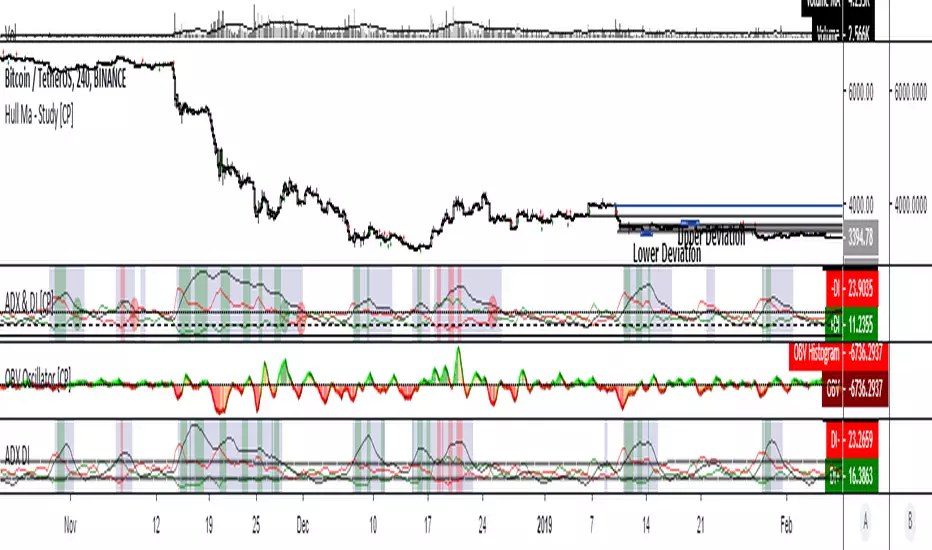
Directional Indicator Strategy v1.2ADX Trading Strategy , using
ADX, D+ and D-
RSI
Historical Volatility
Hull Moving Averange for the price trend
Stop-loss
The Strategy Report is based on 10.000 USD initial investment without pyramiding, starting on januari the 1st 2018, on a 1D time frame. Taking in account a 0.2% Commission fee per trade.

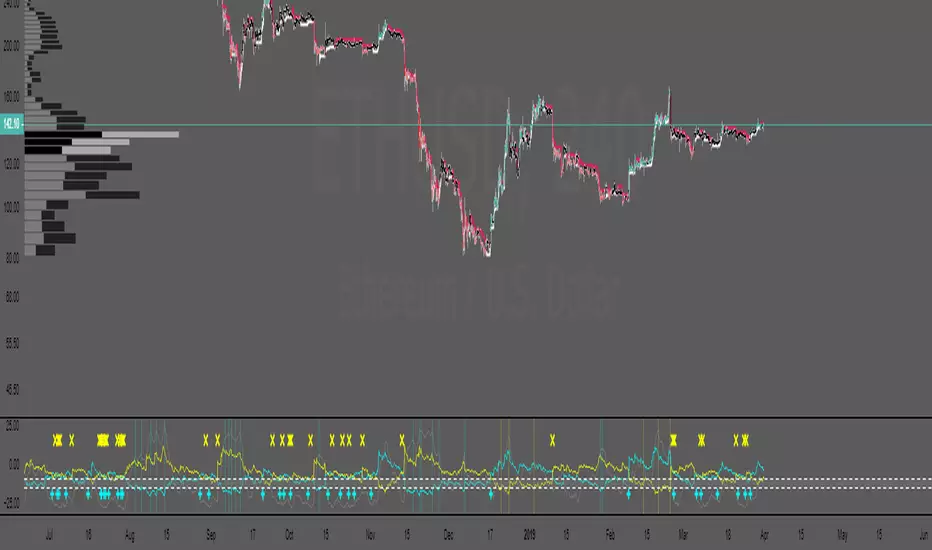
[Long/Short] Range Filter-ADXIt's a useful script for pairs where you can operate long and short.
It's a combination algorithm of the Range filter and the ADX.
The ADX helps to make the decision to enter to open long or short position.
LG --> Long
xL --> Close Long position
ST --> Short
xS --> close Short Position
Enjoy!!!


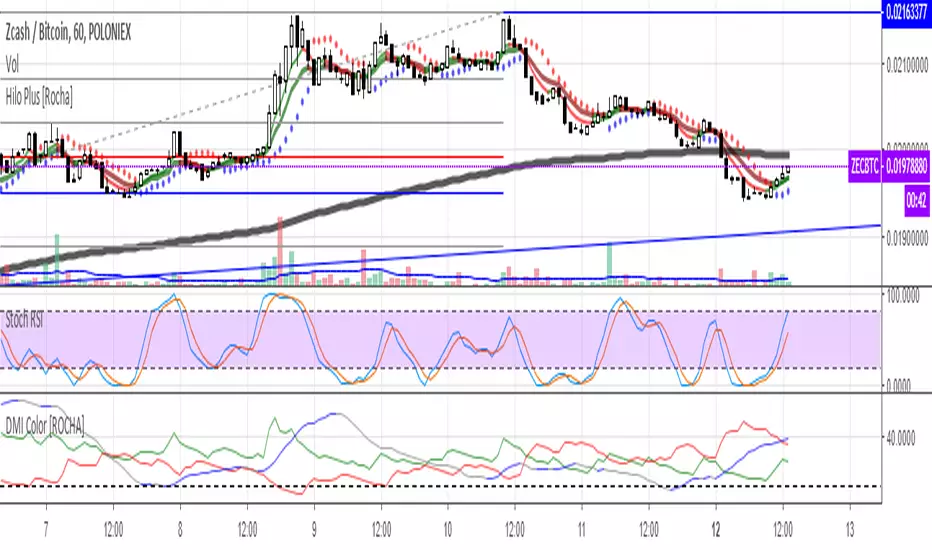
ZR1DMI/ADX
blue is Bull momentum
yellow is Bear momentum
gray line is trending line
dotted is TREND LINE
idea:
look for two lines to be above the dotted TREND LINE
bullish = Bull momentum + Trending Line
bearish = Bear Momentum + Trending Line
when all three are converged or when Tending Line is below dotted its CHOP
Blue flashes when BULL momentum is growing
Yellow flashes when BEAR momentum is growing
NOTE: FOR PA TO MOVE WE DONT ALWAYS NEED 2 LINES ABOVE 1 BELOW
a secondary trade idea is simply on cross over .
when Trending line + one of the momentum lines crosses over the 3rd line (secondary momentum) this can also be seem as trend confirmation.
with that said the strongest and safest set ups are still when 2 is above the TRENDING LINE and 1 below
Color CandlesUses 6 most common indicators to color candles when they give buy/sell signals.
Use line view to see candle colors.
Purple = 6 buy signals
Teal = 5 buy signals
Navy = 4 buy signals
Lime = 3 buy signals
Green = 2 buy signals
Pale Green = 1 Buy signal
White = neutral
Gray = 1 sell signal
Yellow = 2 sell signals
Orange = 3 sell signals
Red = 4 sell signals
Firebrick = 5 sell signals
Black = 6 sell signals
Parabolic SAR calculated as .02, .02, .2. Traditional Buy/Sell. Green/Red Dots.
Bollinger Band calculated as 20, 1. Buy/Sell when above or below band. Aqua filled band.
MACD calculated with emas 12, 26, 9. Traditional MACD/Signal cross Buy/Sell. Filled Blue/Orange band.
RSI length 14. Traditional Buy/Sell below 30 and above 70. Green/Yellow/Red line below price.
ADX/DI len 14. Traditional crossover Buy/Sell. Filled Lime/Green above price.
Stochastic 14/3/3. Traditional 20/80 Buy/Sell. Filled teal/orange above price.

DMI strategy(lirshah)The Directional Movement Index indicator, or DMI, is a trend trading indicator developed by Welles Wilder, which also invented one of the most popular overbought and oversold indicator " RSI indicator".
DMI is based on a scale from 0 to 100 that identifies the price direction and the strength of the trend.
The DMI indicator is composed of three lines:
ADX, which is non-directional, so it will quantify the strength of the trend regardless if it’s bullish or bearish.The ADX line is derived from the relationship of the DMI+ and DMI- lines
DMI+, which measures the strength of the upward price movement.
DMI-, which measures the strength of the downward price movement.
this strategy gives signals according to movements of these three lines and has the best result on xrpusd M15 chart.


Heracles Original Wilder's ADX and DI +/- by ZekisOriginal Wilder's ADX and DI +/- (calculated with the 1978's original formula from Wilder's MA and not with the simple moving average, like almost all ADXs)
I changed the aspect for a nice and easy view
Black/yellow dashed line - threshold
Light blue line = ADX
Blue background - ADX above threshold
Yellow background - ADX bellow threshold
Green line - DI +
Red line - DI -
Green DI+/- background and green triangles - uptrend
Red DI +/- background and red triangles - downtrend
Candlesticks are colored according to the pattern
Possibility to enable or disable trend filter (threshold)
Alerts are added for entries and exits or longs or shorts
Green triangle - long/enter
Red triangle - short/exit
Yellow contaminated area - no certain trend
Green candles - uptrend
Red candles - downtrend
Yellow candles - no certain trend
Enjoy!
@ Zekis

[ALERTS] ADX and DIThe average directional index (ADX) is a technical analysis metric. Analysts use it to determine the relative strength of a trend, with the direction of the trend either upwards or downwards.
The Average Directional Index (ADX) along with the Negative Directional Indicator (-DI) and the Positive Directional Indicator (+DI) are momentum strength indicators that evolved for use in stock trading. Commodities trader J. Welles Wilder pioneered their use. Technical traders who use charting techniques want to know when first spotting a shifting trend how strong that trend is and how likely it is to sustain itself over time. The ADX helps investors determine trend strength as they plan their investment strategies.
Confirmation on a chart and other momentum indicators help investors spot trend reversals. But some trends are more potent than others and investors want to better understand the strength of a trend. The ADX identifies a strong positive trend when the ADX is over 25 and a weak trend when the ADX is below 20. Investors can determine directional movement by analyzing the difference between two consecutive low prices and their correlated highs. The movement is +DM when the current high price, less the previous high price, is greater than the previous low price less the current low. The opposite applies in determining the negative or –DI.
When analyzing charts, stock price is the single most important variable to follow. ADX and other indicators are supplementary to price movements in providing additional directional information and support. For example, some of the best trends come about from price range consolidation. It is those tugs of war between buying and selling volumes that lead to breakouts and other trading opportunities.
The Inventor of the Average Directional Index
J. Welles Wilder, Jr. is a former American engineer and real estate developer who went on to revolutionize trading analysis by applying mathematical systems to the world of investing. In addition to developing the ADX, Wilder is also responsible for several other commonly used technical analysis tools including the Average True Range (ATR), the Relative Strength Index (RSI) and the Parabolic SAR.
www.investopedia.com
This script has alerts and includes the filter for markets with no trend defined.
Green Alert --> Long
Red Alert --> Short
Yellow Area --> Weak trend. ADX below threshold
Green candles --> Bullish Market
Red Candles --> Bearish Market
Orange candles --> No defined trend
Enjoy!


ADX and DI by T-GODwe change the way that hoe the adx and di shows.
the background shows the adx.
the red color means di+di-.

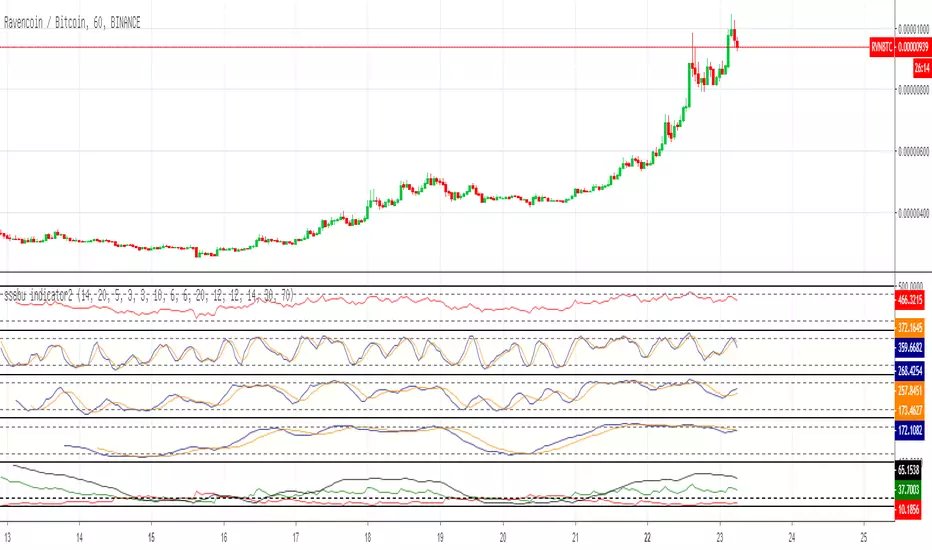
SSABU Indicator2
─────────────────────────────────────
3 Stochastic
1 RSI
1 ADX and DI
Use it if you need auxiliary indicators!
─────────────────────────────────────
스톡캐스틱 3개
RSI 1개
ADX and DI 1개
보조지표 갯수 모자란분들 사용하세요!
─────────────────────────────────────
✅ Other indicators to help you trade
✅ 매매에 도움되는 다른 보조지표
Basel major swing 2.2