Alert Before Bar Closei.imgur.com
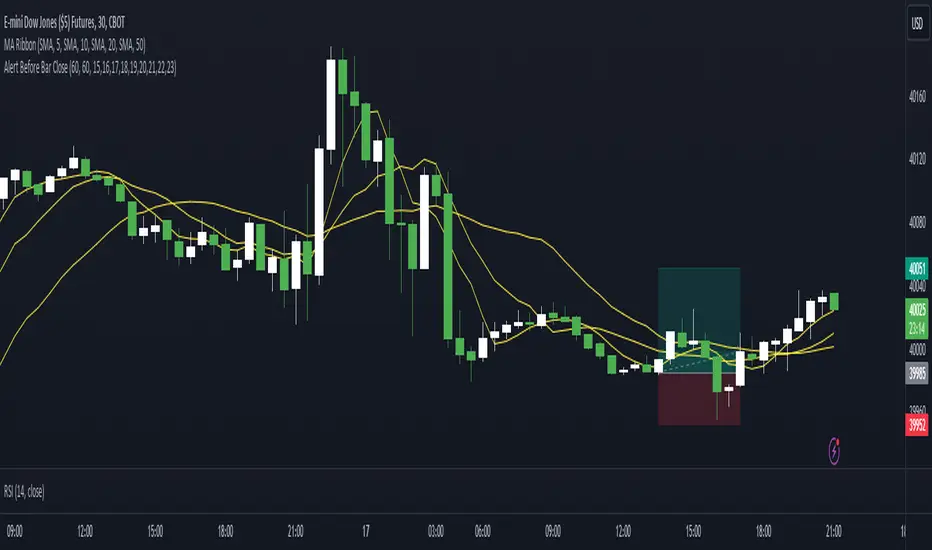
Alert Before Bar Close
==========================
Example Figure
Originality and usefulness
This indicator/alert mechanism is unique in two ways. First, it provides alerts before the close of a candlestick, allowing time-based traders to prepare early to determine if the market is about to form a setup. Second, it introduces an observation time mechanism, enabling time-based traders to observe when the market is active, thereby avoiding too many false signals during electronic trading or when trading is light.
Detail
Regarding the settings (Arrow 1). The first input is to select the candlestick period you want to observe. The second is to notify a few seconds in advance. The third input sets the observation time. For example, if you set "1,2,3,4,5," the alert mechanism will only be activated during the period from 01:00:00 to 05:59:59, consistent with the time zone you set in TradingView. Additionally, I have set it so that the alert will only trigger once per candlestick, so don't worry about repeated alerts.
The alert setup is very simple, too. Follow the steps (Arrow 2, 3) to complete the setup. I have tested several periods and successfully received alerts on both mobile and computer. If anyone encounters any issues, feel free to let me know.
Alert
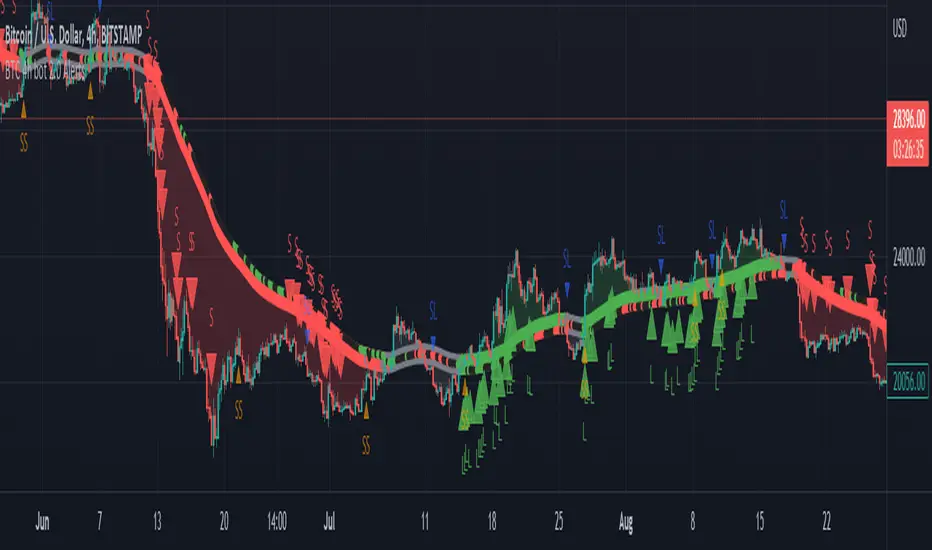
Normalised T3 Oscillator [BackQuant]Normalised T3 Oscillator
The Normalised T3 Oscillator is an technical indicator designed to provide traders with a refined measure of market momentum by normalizing the T3 Moving Average. This tool was developed to enhance trading decisions by smoothing price data and reducing market noise, allowing for clearer trend recognition and potential signal generation. Below is a detailed breakdown of the Normalised T3 Oscillator, its methodology, and its application in trading scenarios.
1. Conceptual Foundation and Definition of T3
The T3 Moving Average, originally proposed by Tim Tillson, is renowned for its smoothness and responsiveness, achieved through a combination of multiple Exponential Moving Averages and a volume factor. The Normalised T3 Oscillator extends this concept by normalizing these values to oscillate around a central zero line, which aids in highlighting overbought and oversold conditions.
2. Normalization Process
Normalization in this context refers to the adjustment of the T3 values to ensure that the oscillator provides a standard range of output. This is accomplished by calculating the lowest and highest values of the T3 over a user-defined period and scaling the output between -0.5 to +0.5. This process not only aids in standardizing the indicator across different securities and time frames but also enhances comparative analysis.
3. Integration of the Oscillator and Moving Average
A unique feature of the Normalised T3 Oscillator is the inclusion of a secondary smoothing mechanism via a moving average of the oscillator itself, selectable from various types such as SMA, EMA, and more. This moving average acts as a signal line, providing potential buy or sell triggers when the oscillator crosses this line, thus offering dual layers of analysis—momentum and trend confirmation.
4. Visualization and User Interaction
The indicator is designed with user interaction in mind, featuring customizable parameters such as the length of the T3, normalization period, and type of moving average used for signals. Additionally, the oscillator is plotted with a color-coded scheme that visually represents different strength levels of the market conditions, enhancing readability and quick decision-making.
5. Practical Applications and Strategy Integration
Traders can leverage the Normalised T3 Oscillator in various trading strategies, including trend following, counter-trend plays, and as a component of a broader trading system. It is particularly useful in identifying turning points in the market or confirming ongoing trends. The clear visualization and customizable nature of the oscillator facilitate its adaptation to different trading styles and market environments.
6. Advanced Features and Customization
Further enhancing its utility, the indicator includes options such as painting candles according to the trend, showing static levels for quick reference, and alerts for crossover and crossunder events, which can be integrated into automated trading systems. These features allow for a high degree of personalization, enabling traders to mold the tool according to their specific trading preferences and risk management requirements.
7. Theoretical Justification and Empirical Usage
The use of the T3 smoothing mechanism combined with normalization is theoretically sound, aiming to reduce lag and false signals often associated with traditional moving averages. The practical effectiveness of the Normalised T3 Oscillator should be validated through rigorous backtesting and adjustment of parameters to match historical market conditions and volatility.
8. Conclusion and Utility in Market Analysis
Overall, the Normalised T3 Oscillator by BackQuant stands as a sophisticated tool for market analysis, providing traders with a dynamic and adaptable approach to gauging market momentum. Its development is rooted in the understanding of technical nuances and the demand for a more stable, responsive, and customizable trading indicator.
Thus following all of the key points here are some sample backtests on the 1D Chart
Disclaimer: Backtests are based off past results, and are not indicative of the future.
INDEX:BTCUSD
INDEX:ETHUSD
BINANCE:SOLUSD

Price alert multi symbols (Miu)This indicator won't plot anything to the chart.
Please follow steps below to set your alarms based on multiple symbols' prices:
1) Add indicator to the chart
2) Go to settings
3) Check symbols you want to receive alerts (choose up to 8 different symbols)
4) Set price for each symbol
5) Once all is set go back to the chart and click on 3 dots to set alert in this indicator, rename your alert and confirm
6) You can remove indicator after alert is set and it'll keep working as expected
What does this indicator do?
This indicator will generate alerts based on following conditions:
- If price set is met for any symbol
Once condition is met it will send an alert with the following information:
- Symbol name (e.g: BTC, ETH, LTC)
- Price reached
This script requests current price for each symbol through request.security() built-in function. It also requests amount of digits (mintick) for each symbol to send alerts with correct value.
This script was developed to attend a demand from a comment in other published script.
Feel free to give feedbacks on comments section below.
Enjoy!
FOMO Alert (Miu)This indicator won't plot anything to the chart.
Please follow steps below to set your alarms based on price range variation:
1) Add indicator to the chart
2) Go to settings
3) Choose timeframe which will be used to calculate bars
4) Choose how many bars which will be used to calculate max and min range
5) Choose max and min range variation (%) to trigger alerts
5) Choose up to 6 different symbols to get alert notification
6) Once all is set go back to the chart and click on 3 dots to set alert in this indicator, rename your alert and confirm
7) You can remove indicator after alert is set and it'll keep working as expected
What does this indicator do?
This indicator will generate alerts based on following conditions:
- If min and max prices reach the range (%) from amount of bars on timeframe set for any symbol checked it will trigger an alert.
- If next set of bars reaches higher range than before it will trigger an alert with new data
- If next set of bars doesn't reach higher range than before it will not trigger alerts, even if they are above the range set (this is to prevent the alert to keep triggering with high frequency)
Once condition is met it will send an alert with the following information:
- Symbol name (e.g: BTC, ETH, LTC)
- Range achieved (e.g: 3,03%)
- Current symbol price and current bar direction (e.g: 63,477.1 ▲)
This script will request lowest and highest prices through request.security() built-in function from all different symbols within the range set. It also requests symbols' price (close) and amount of digits (mintick) for each symbol to send alerts with correct value.
This script was developed with main purpose to send alerts when there are strong price movements and I decided to share with community so anyone can set different parameters for different purposes.
Feel free to give feedbacks on comments section below.
Enjoy!

Alert Sender Library [TradingFinder]Library "AlertSenderLibrary_TradingFinder"
🔵 Introduction
The "Alert Sender Library" is a management and production program for "Alert Messages" that enables the creation of unique messages for any type of signal generated by indicators or strategies.
These messages include the direction of the signal, symbol, time frame, the date and time the condition was triggered, prices related to the signal, and a personal message from you. To make better and more optimal use of this "library", you should carefully study " Key Features" and "How to Use".
🔵 Key Features
Automatic Detection of Appropriate Type :
Using two parameters, "AlertType" and "DetectionType", which you must enter at the beginning into the "AlertSender" function, the type of the alert message is determined.
For example, if you select one of the "DetectionType"s such as "Order Block Signal", "Signal", and "Setup", your alert type will be chosen based on "Long" and "Short". Whether it's "Long" or "Short" depends on the "AlertType" you have set to either "Bullish" or "Bearish".
Automatic Symbol Detection :
Whenever you add an alert for a specific symbol, if you want the name of that symbol to be in your message text, you must manually write the name of the symbol in your message. One of the capabilities of the "Alert Sender" is the automatic detection of the symbol and adding it to the message text.
Automatic Time Frame Detection :
When adding your alert, the "Alert Sender" detects the time frame of the symbol you intend to add the alert for and adds it to the text. This feature is very practical and can prevent traders from making mistakes.
For example, a trader might add alerts for a specific symbol using a specific indicator in different time frames, taking the main signal in the 1-hour time frame and only a confirmation signal in the 15-minute time frame. This feature helps to identify in which time frame the signal is set.
Detection of Date and Time When the Signal is Triggered :
You can have the date and time at the moment the message is sent. This feature has various uses. For example, if you use the Webhook URL feature to send messages to a Telegram channel, there might be issues with alert delivery on your server, causing delays, and you might receive the message when it has lost its validity.
With this feature, you can match the sending time of the message from TradingView with the receipt time in your messenger and detect if there is a delay in message delivery.
Important :
You can also set the Time Zone you wish to receive the date and time based on.
Display of "Key Prices" :
Key prices can vary based on the type of signals. For example, when the "DetectionType" is in "Order Block Signal" mode, the key prices are the "Distal" and "Proximal" prices. Or if the "DetectionType" is in "Setup" mode, the key prices are "Entry", "Stop Loss", and "Take Profit".
Receipt of Personal "Messages" :
You can enter your personal message using "input.string" or "input.text_area" in addition to the messages that are automatically created.
Beautiful and Functional Display of Messages :
The titles of messages sent by "AlertSender" are displayed using related emojis to prevent mistakes due to visual errors, enhancing beauty.
🔵 How to Use
🟣 Familiarity with Function and Parameters
AlertSender(Condition, Alert, AlertName, AlertType, DetectionType, SetupData, Frequency, UTC, MoreInfo, Message, o, h, l, c, Entry, TP, SL, Distal, Proximal)
Parameters:
- Condition (bool)
- Alert (string)
- AlertName (string)
- AlertType (string)
- DetectionType (string)
- SetupData (string)
- Frequency (string)
- UTC (string)
- MoreInfo (string)
- Message (string)
- o (float)
- h (float)
- l (float)
- c (float)
- Entry (float)
- TP (float)
- SL (float)
- Distal (float)
- Proximal (float)
To add "Alert Sender Library", you must first add the following code to your script.
import TFlab/AlertSenderLibrary_TradingFinder/1
🟣 Parameters
"Condition" : This parameter is a Boolean. You need to set it based on the condition that, when met (or fired), you want to receive an alert. The output should be either "true" or "false".
"Alert" : This parameter accepts one of two inputs, "On" or "Off". If set to "On", the alarm is active; if "Off", the alarm is deactivated. This input is useful when you have numerous alerts in an indicator or strategy and need to activate only a few of them. "Alert" is a string parameter.
Alert = input.string('On', 'Alert', , 'If you turn on the Alert, you can receive alerts and notifications after setting the "Alert".', group = 'Alert')
"AlertName" : This is a string parameter where you can enter the name you choose for your alert.
AlertName = input.string('Order Blocks Finder ', 'Alert Name', group = 'Alert')
"AlertType" : The inputs for this parameter are "Bullish" or "Bearish". If the condition selected in the "Condition" parameter is of a bullish bias, you should set this parameter to "Bullish", and if the condition is of a bearish bias, it should be set to "Bearish". "AlertType" is a string parameter.
"DetectionType" : This parameter's predefined inputs include "Order Block Signal", "Signal", "Setup", and "Analysis". You may provide other inputs, but some functionalities, like "Key Price", might be lost. "DetectionType" is a string parameter.
"SetupData" :
If "DetectionType" is set to "Setup", you must specify "SetupData" as either "Basic" or "Full". In "Basic" mode, only the "Entry" price needs to be defined in the function, and "TP" (Take Profit) and "SL" (Stop Loss) can be any number or NA. In "Full" mode, you need to define "Entry", "SL", and "TP". "Setup" is a string parameter.
"Frequency" : This string parameter defines the announcement frequency. Choices include: "All" (activates the alert every time the function is called), "Once Per Bar" (activates the alert only on the first call within the bar), and "Once Per Bar Close" (the alert is activated only by a call at the last script execution of the real-time bar upon closing). The default setting is "Once per Bar".
Frequency = input.string('Once Per Bar', 'Message Frequency', , 'The triggering frequency. Possible values are: All (all function calls trigger the alert), Once Per Bar (the first function call during the bar triggers the alert), Per Bar Close (the function call triggers the alert only when it occurs during the last script iteration of the real-time bar, when it closes). The default is alert.freq_once_per_bar.', group = 'Alert')
"UTC" : With this parameter, you can set the Time Zone for the date and time of the alert's dispatch. "UTC" is a string parameter and can be set as "UTC-4", "UTC+1", "UTC+9", or any other Time Zone.
UTC = input.string('UTC', 'Show Alert time by Time Zone', group = 'Alert')
"MoreInfo" : This parameter can take one of two inputs, "On" or "Off", which are strings. Additional information, including "Time" and "Key Price", is included. If set to "On", this information is received; if "Off", it is not displayed in the sent message.
MoreInfo = input.string('On', 'Display More Info', , group = 'Alert')
"Message" : This parameter captures the user's personal message through an input and displays it at the end of the sent message. It is a string input.
MessageBull = input.text_area('Long Position', 'Long Signal Message', group = 'Alert') MessageBear = input.text_area('Short Position', 'Short Signal Message', group = 'Alert')
"o" (Open Price): A floating-point number representing the opening price of the candle. This input is necessary when the "DetectionType" is set to "Signal". Otherwise, it can be any number or "na".
"h" (High Price): A float variable for the highest price of the candle. Required when "DetectionType" is "Signal"; in other cases, any number or "na" is acceptable.
"l" (Low Price): A float representing the lowest price of the candle. This field must be filled if "DetectionType" is "Signal". If not, it can be any number or "na".
"c" (Close Price): A floating-point variable indicating the closing price of the candle. Needed for "Signal" type detections; otherwise, it can take any value or "na".
"Entry" : A float variable indicating the entry price into a trading setup. This is relevant when "DetectionType" is in "Setup" mode. In other scenarios, it can be any number or "na". It denotes the price at which the trade setup is entered.
"TP" (Take Profit): A float that is necessary when "DetectionType" is "Setup" and "SetupData" is "Full". Otherwise, it can be any number or "na". It signifies the price target for taking profits in a trading setup.
"SL" (Stop Loss): A float required when "DetectionType" is "Setup" and "SetupData" is "Full". It can be any number or "na" in other cases. This value represents the price at which a stop loss is set to limit losses.
"Distal" : A float important for "Order Block Signal" detection. It can be any number or "na" if not in use. This variable indicates the price reaching the distal line of an order block.
"Proximal" : A float needed for "Order Block Signal" detection mode. It can take any value or "na" otherwise. It marks the price reaching the proximal line of an order block.

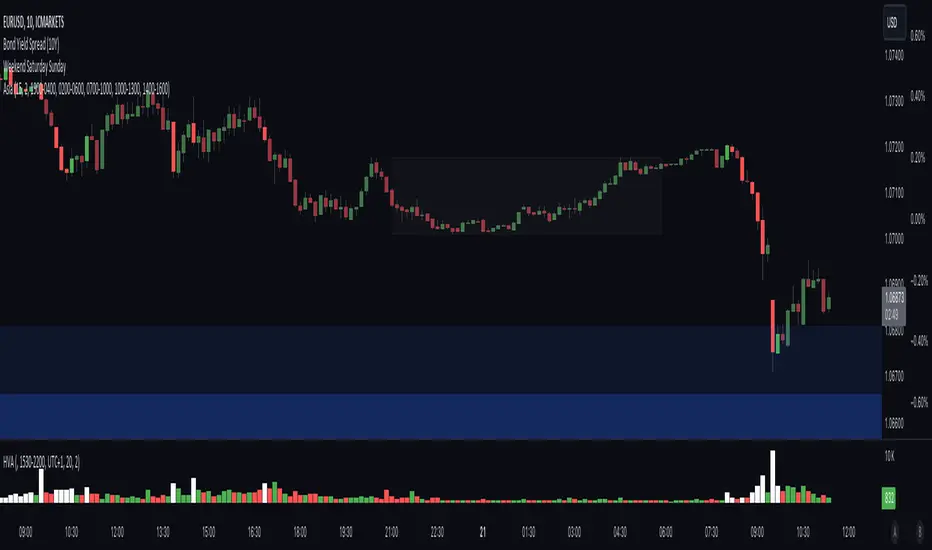
High Volume AlertThe High Volume Alert Script is developed for all traders focusing on volume analysis in their trading strategies, providing alerts for unusually high trading volumes during specified trading sessions.
Functionality:
Volume Moving Average Calculation:
Average Volume = Moving Average(Volume) = Sum of last the x last candles Volume
Where n is the user-defined period for the moving average calculation (denoted as movingaverageinput in the script. This moving average serves as the baseline to compare current volume levels against historical averages.
High Volume Detection:
HighVolume = CurrentVolume >= (MA(Volume) x HighVolumeRatio)
Here, HighVolumeRatio is a user-defined multiplier that sets the threshold for what is considered high volume. If the current volume exceeds this threshold (the product of the moving average of volume and the HighVolumeRatio ), the script identifies this as a high-volume event.
Session Filtering:
The script further refines these alerts by ensuring they only trigger during the specified trading session, enhancing relevance for traders interested in specific market hours. This session is defined by the sess and timezone parameters.
Visualisation and Alerts:
If high volume is detected (HighVolume = True), the script colors the volume bar with the highVolumeColor . If the option is selected, it also changes the color of the candlestick to either highVolumeCandleColorUp (for bullish candles) or highVolumeCandleColorDown (for bearish candles), depending on the price movement within the high-volume period. An alert is generated through the alertcondition function when high volume is detected during the specified session, notifying the trader of potentially significant market activity.
Application in Trading:
This indicator serves traders who prioritize volume as a leading indicator of potential price movement. High trading volumes may indicate the presence of significant market activity, often associated with events like news releases, market openings, or large trades, which can precede price movements.
Originality and Practicality:
This script is self-developed, aiming to fill the gap in automatic ratio adjusted volume alerts within the TradingView environment.
Conclusion:
The High Volume Alert Script is an essential tool for traders who integrate volume analysis into their strategy, offering tailored alerts and visual cues for high volume periods.
Compliance and Limitations:
The script complies with TradingView scripting standards, ensuring no lookahead bias and maintaining real-time data integrity. However, its utility depends on the availability on volume data, and please be aware that forex pairs never offer real volume data, this tool is best used with a exchange traded symbol.
How to force strategies fire exit alerts not reversalsPineScript has gone a long way, from very simple and little-capable scripting language to a robust coding platform with reliable execution endpoints. However, this one small intuitivity glitch is still there and is likely to stay, because it is traditionally justified and quite intuitive for significant group of traders. I'm sharing this workaround in response to frequent inquiries about it.
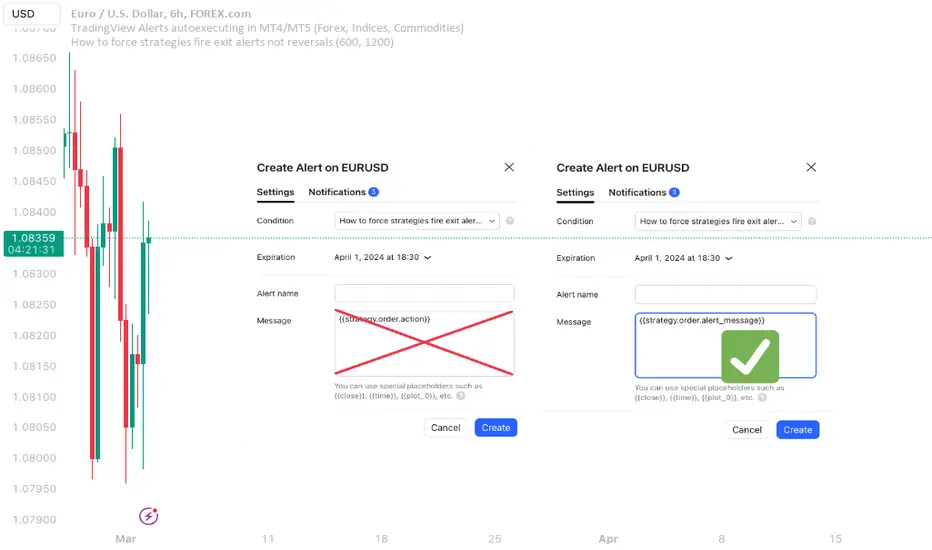
What's the glitch? When setting alerts on strategies to be synchronized with TradingView's Strategy Tester events, using simple alert messages such as "buy" or "sell" based on entry direction seems straightforward by inserting {{strategy.order.action}} into the Create Alert's "Message" field. Because "buy" or "sell" are exactly the strings produced by {{strategy.order.action}} placeholder. However, complications arise when attempting to EXIT positions without reversing, whether triggered by price levels like Stop Loss or Take Profit, or logical conditions to close trades. Those bricks fall apart, because on such events {{strategy.order.action}} sends the same "sell" for exiting buy positions and "buy" for exiting sell positions, instead of something more differentiating like "closebuy" or "closesell". As a result reversal trades are opened, instead of simply closing the open ones.
This convention harkens back to traditional stock market practices, where traders either bought shares to enter positions or sold them to exit. However, modern trading encompasses diverse instruments like CFDs, indices, and Forex, alongside advanced features such as Stop Loss, reshaping the landscape. Despite these advancements, the traditional nomenclature persists.
And is poised to stay on TradingView as well, so we need a workaround to get a simple strategy going. Luckily it is here and is called alert_message . It is a parameter, which needs to be added into each strategy.entry() / strategy.exit() / strategy.close() function call - each call, which causes Strategy Tester to produce entry or exit orders. As in this example script:
line 12: strategy.entry(... alert_message ="buy")
line 14: strategy.entry(... alert_message ="sell")
line 19: strategy.exit(... alert_message ="closebuy")
line 20: strategy.exit(... alert_message ="closesell")
line 24: strategy.close(... alert_message ="closebuy")
line 26: strategy.close(... alert_message ="closesell")
These alert messages are compatible with the Alerts Syntax of TradingConnector - a tool facilitating auto-execution of TradingView alerts in MetaTrader 4 or 5. Yes, simple alert messages like "buy" / "sell" / "closebuy" / "closesell" suffice to carry the execution of simple strategy, without complex JSON files with multiple ids and such. Other parameters can be added (actually plenty), but they are only option and that's not a part of this story :)
Last thing left to do is to replace "Message" in Create Alert popup with {{strategy.order.alert_message}} . This placeholder transmits the string defined in the PineScript alert_message= parameter, as outlined in this publication. With this workaround, executing closing alerts becomes seamless within PineScript strategies on TradingView.
Disclaimer: this content is purely educational, especially please don't pay attention to backtest results on any timeframe/ticker.
TrailingTakeProfit exampleQuite recently I came upon a concept of Trailing Take Profit and I couldn't find a PineScript which implements it for the fastest possible execution, so here it is :)
Everybody knows Trailing StopLoss - an invisible mechanism follows the price and exits the trade once the price retreats too much from its recent most extended favourable value. Trailing TakeProfit does the similar thing, but at the opposite end - the trade gets closed if a price moves too well, in too favourable extent.
Why close the trade if it is going so good? Well, whatever goes up, must go down and vice versa. It is expected, that after fast rally a market will soon fall and after a dump it will go up. So Trailing TakeProfit's role is to secure profits.
But how does Trailing TakeProfit differ from the standard one? "Trailing" means, the exit level is moving. Its role is to be executed only after a rapid favourable move within 1-2 candles, not more. We never know when a rapid move happens, but when it does, we wanna catch those pips and quickly exit without looking back.
Visually Trailing TakeProfit levels are... bands. In this script example these are ATR multiplied bands (aka Keltner Channel), but they could also be Bollinger Bands or something else.
The code is simple just to focus on this single functionality, so you can quickly copy-paste it into your script. Entries are triggered by default SMA crosses.
P.S. I wouldn't be myself, if I didn't add alert messages compatible with the syntax of recently revamped TradingConnector - both in the code already and in the table showing them.

Alert on Candle CloseAlert on Candle Close is a simple indicator allowing you to set alerts when a candlestick closes.
Instructions for use
From the chart window, click on "Indicators" and search for "Alert on Candle Close".
Click on "Alert on Candle Close" to add the indicator to your chart. Click on the star icon to add it to your favourites to easily access later.
Set your chart timeframe to the timeframe you wish to alert on. For example, to create an alert when a 4h candlestick closes, set your chart to the "4h" timeframe.
Hover over the "Alert on Candle Close" indicator which has been added to your chart and click the ellipsis "..." icon, then click "Add alert on Alert on Candle Close" or use the keyboard shortcut "Alt+A" from the chart.
In the alert pop-up window, make sure "Condition" is set to "Alert on Candle Close" and "Trigger" is set to "Once Per Bar".
Optionally, you can set a custom expiry for the alert, give the alert a name and customise the alert message. You can configure notification settings from the "Notifications" tab.
Click "Create" and your alert is set up!
Each alert is tied to the timeframe and chart it was created on, so you can change the timeframe or asset and create more alerts by repeating the above process.
Note : this indicator is only designed to work with time-based chart types, such as Bars, Candles or Heikin Ashi. It will not work for non-time charts such as Renko.
FAQs
Why do my alerts sometimes not fire as soon as the candle closes?
This is a limitation with Pine Script's execution model. Indicators are calculated whenever a price or volume change occurs i.e. when a new trade happens. For illiquid or slow moving markets, there may be some time between when a candle closes and the next trade, leading to a delay in the alert triggering. The alert will trigger on the next tick of data on the chart.
Why can't I create more alerts?
TradingView has a limit on the number of active technical alerts you can have based on your membership tier. To configure more alerts, consider upgrading your TradingView plan to a higher tier. See a comparison of TradingView plans at www.tradingview.com
My alert only fired once, how can I get it to keep working?
When configuring the alert in the alert pop-up window, make sure you set "Trigger" to "Once Per Bar" and "Expiration" to "Open-ended alert".

Manual Buy&Sell Alerts [Starbots]This is a simple Strategy created to help you manually execute open or close orders via Alerts on Exchanges or Platforms.
More and more Exchanges and Platforms allow Tradingview Alert trading and sometimes we come to a problem that we can not sell an open order on the exchanges other way than signaling a sell or buy from Tradingview Alerts.
This is a tool to solve that problem as your are able to manually:
- send alert on limit targets (Long limit target, Short limit target, Take Profit limit target, Stop Loss limit target)
- send alert when new live bar opens on the market (simple way for closing your open trades on the Exchange/Platform - it will sell your open Long/Short order after new live bar is opened on the market)
Functions:
- 🕛Start
Define a start time for strategy to open/close trades
- 🕐Stop Trading after your Order is Closed
If you wish to stop opening/closing trades after your first position is successfully closed keep this turned on. If you wish to keep opening/closing trades indefinitely when the conditions are met keep this turned off.
🏁Buy&Sell By Limit Target
-Buy Price
-Take Profit
-Stop Loss
-🟢Enable Long Limit Orders
-🔴Enable Short Limit Orders
If you enable Enable Long or Short limit orders you will be able to execute trades when the price reaches your limit target lines.
Please Note that if you turn on Shorting, your Take Profit limit target must be 'UNDER' your buy price and Stop Loss limit target must be 'ABOVE' your buy price.
Type in your limit values manually or re-apply the strategy to your chart to select limit targets again with a mouse - you can also drag the limit lines to your wanted areas.
(I recommend using low time-frame charts - 30s, 1minute for fast executions)
🏁Buy&Sell After New Bar Opens
-🟢Open Long
-Close Long on a new Open Bar
-🔴Open Short
-Close Short on a new Open Bar
This is a simple way for closing your open trade on Exchanges. If you select Open Long/Short and then Close Long/Short on a new Open bar it will sell your open order and send sell alert when the new bar is opened on the market. Choose your time-frame and execute immediate sell order when a new bar is opened. You can select low 15s-30s-1minute charts to quickly get a sell alert.
Alerts
Long Message
Short Message
Exit Long Message
Exit Short Message
You can type in your webhook alert messages in this inputs. Write this code in 'Message' when creating Alert for strategy to send your Buy/Sell messages from above inputs.
{{strategy.order.alert_message}}
If you trade on exchanges and use different dynamic alert message to trade from Strategies, then you can just leave Alert inputs empty and write down your message alert in 'Message' box when creating new alert normally.
>> Do not forget to also set order size and pyramiding in properties tab correctly in this case.

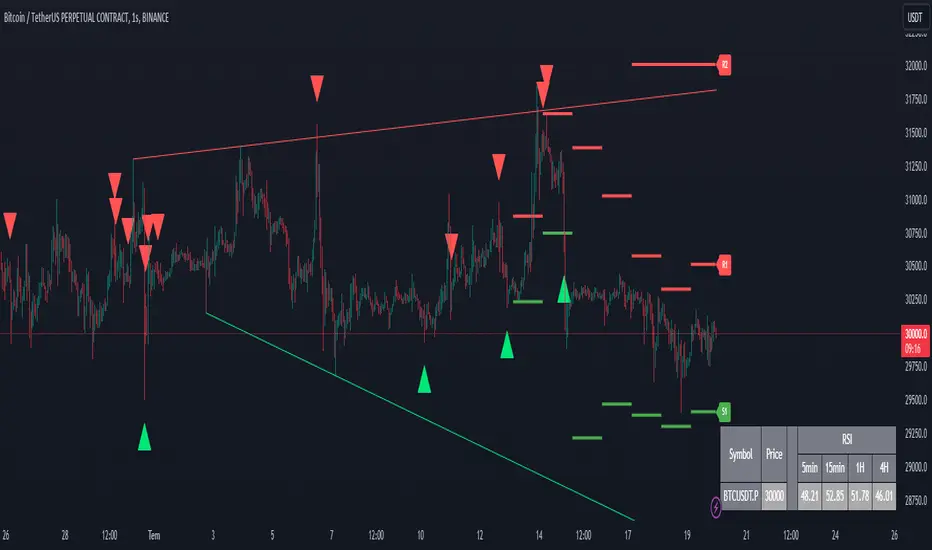
CoinFxPro Range indicator V 1.0This indicator has a structure that combines daily and weekly pivot levels, moving averages, and strength index-linked oscillators. The purpose of the indicator is designed to analyze price movements and identify potential trend reversals. Daily pivot levels are helpful in identifying critical support and resistance zones, while moving averages and oscillators indicate overbought or oversold situations in the price.
It is very simple to use and simple in appearance.
Triangular Signals appearing on the chart screen come when the price touches the daily or weekly support and resistance levels.
If you want the signals to be received less or more healthy, I added the filtering feature. In this way, you can filter the incoming signals through the volume or volatility filter, so that less signals are received.
On the other hand, the 4 timeframe rsi values of the price for daily use of the indicator are also given in the table.
You can change the RSI timeframes as you wish.
In this way, it is seen more clearly whether the signal is healthy and provides convenience while trading.
Evaluation of incoming signals;
First of all, when the signal occurs, pay attention to whether the RSI values that occur in the timeframe you trade and in other timeframes are overbought (red) or oversold (green).
When the signal comes, I buy or sell, especially if the RSI values in the 5 minutes, 15 minutes and 1 hour time periods are overbought or oversold.
If you wish, you can try a different strategy for yourself.
After the healthiest of the signals on the chart comes, the RSI values are also at overbought or oversold levels in 5-15 minutes and 1 hour timeframes and if there is a Trendline line above or below the price, it is out of that region.
A healthy buying or selling transaction can be made.
It should be noted that since risk = return, high risk means high return. High risk must be taken for high returns. Therefore, I recommend that you do not exceed 10% of your capital as margin when trading with leverage.
When trading, I always recommend trading with additional confirmation from a different indicator.
I also added a filtering feature to the indicator to block market structure related variables. Those who want to use can also use filtering.
I have added the automatic trendline for ease of trading. You can increase or decrease the number of trend lines as you wish.
I just published the indicator for daily use.
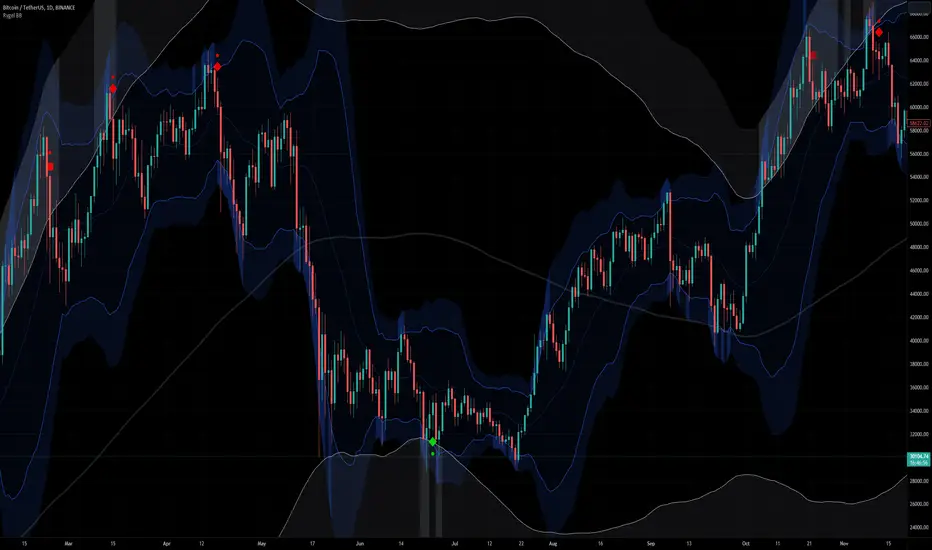
[Rygel] Dual time frame Bollinger Bands with signals and alertsThis indicator displays two Bollinger Bands coming from two different time frames, chart's current one and a higher one.
It analyzes these two Bollinger Bands data and combines them with RSI, MFI and MACD divergences and SuperTrend to identify areas of opportunity where price is the most likely to be at a local top or bottom.
It uses probabilistic data, the Bollinger Bands, to identify convergence areas where the price is statistically overbought or oversold simultaneously at two different time frames, it then looks for signs of a trend exhaustion, using RSI, MFI and MACD divergences, and finally it looks for an early confirmation of a trend reversal, using SuperTrend data with aggressive settings.
This indicator does not produce buy and sell signals. You won't get a buy for every sell or a sell for every buy. In a bearish trend, you may get multiple consecutive bullish signals and in a bullish trend multiple bearish signals.
It is meant to help you to identify and to alert you about areas of opportunity where you could, for instance, consider taking some profits or opening a trade.
It is meant to support your investment or trading decisions, not to induce them.
SIGNALS
This indicator generated multiple types of signals. Diamonds are better than squares. Colored ones are better than grey ones.
Green square: a bullish signal confirmed by a regular divergence
Red square: a bearish signal confirmed by a regular divergence
Blue square: a bullish signal confirmed by a hidden divergence (disabled by default as these signals are less reliable)
Orange square: a bearish signal confirmed by a hidden divergence (disabled by default as these signals are less reliable)
Diamonds: same as the square signals but the signal is forming a divergence with a previous one. Diamond signals are always stronger (i.e. more reliable) than square signals.
Grey signals: same as the previous ones but for weaker signals. These signals appear when price in the current time frame is overbought or oversold but only close to be at the higher timeframe. (disabled by default as these signals are less reliable)
When a weak signal follows a strong one and creates a MACD divergence with it, it will be considered as a strong signal and displayed as a colored signal, even when weak signals are disabled.
When a strong signal follows a weak one, forming a MACD divergence, it will be shown as a diamond signal, even when weak signals are disabled.
Most reliable signals are green and red diamonds.
SETTINGS
Bollinger Bands
Source: the source used to calculate the Bollinger Bands ("close" by default)
Length: the moving-average length of the Bollinger Bands (20 by default)
You will most likely have no need to change these settings. If you're wondering what they actually do, you should most likely not touch them.
Main channel standard deviation: the standard deviation used to calculate the classical Bollinger Bands channel. (2.0 by default)
Outer bands standard deviation: additional channels outside the main one, using a larger standard deviation. (3.0 by default)
Theoretically, with a 1.0 standard deviation, around 68% of the price action should be contained within the Bollinger Bands.
With a 2.0 standard deviation, around 95%.
With a 3.0 standard deviation, around 99.7%.
With a 4.0 standard deviation, around 99.99%.
But as security prices returns have no actual statistical distribution, these probabilities don't strictly apply to Bollinger Bands. According to Wikipedia, studies have found that with a 2.0 standard deviation, only about 88% (85–90%) of the price data remain with the Bollinger Bands, instead of the theoretical 95%.
The higher you set the values, the less signals you'll get.
You should most likely keep the main channel standard deviation between 2 and 3 and add between +0.5 and +1 for the outer bands.
Most commonly used value for Bollinger Bands is 2.0.
Current time frame
Show current time frame Bollinger Bands: these are the Bollinger Bands you're used to. (enabled by default)
Show current time frame outer bands: add two additional bands outside the main channel using a larger standard deviation. (enabled by default)
Higher time frame
Show higher time frame Bollinger Bands: display secondary Bollinger Bands from a higher time frame. Time frames are configured in the below "Time frames" section. (enabled by default)
Show higher time frame outer bands: add two additional bands outside the main channel using a larger standard deviation (enabled by default)
Overbought and oversold
Show oversold and overbought background: add a background to the higher time Bollinger Bands whose color depends on the dual time frame Bollinger Bands oversold / overbought status. (enabled by default)
Asset is considered overbought/oversold when its price is outside of the Bollinger Bands' main channel.
Asset is considered strongly overbought/oversold when its price is outside of the Bollinger Bands' outer bands.
Dark red: both time frame are overbought (outside the main channel)
Red: one time frame is strongly overbought (outside the outer bands) and the other one is overbought (outside the main channel)
Bright red: both time frame are strongly overbought (outside the outer bands)
Dark green: both time frame are oversold (outside the main channel)
Green: one time frame is strongly oversold (outside the outer bands) and the other one is oversold (outside the main channel)
Bright green: both time frame are strongly oversold (outside the outer bands)
Signals
Show signals: display signals when an area of opportunity is detected. Read the introduction and the Signals section for more information. (enabled by default)
Show weak signals: display signals although at the higher time frame price is not yet overbought or oversold but close to be (disabled by default)
Divergences
Use MACD for divergences (enabled by default)
Use MFI for divergences (enabled by default)
Use RSI for divergences (enabled by default)
At least one source of divergences must be enabled for signals to work.
Enable hidden divergences: signals don't use hidden divergences by default as they generate more false positives than regular divergences. You can enable them to get more signals, it can be especially useful at high time frames (like weekly, monthly, etc.) where signals are rarer. (disabled by default)
Show divergences: draw MACD, MFI and RSI divergences on the chart. (disabled by default)
Green: regular bullish divergence
Red: regular bearish divergence
Blue: hidden bullish divergence
Orange: hidden bearish divergence
Confirmation
Confirmation speed: a faster confirmation speed will generate more false positive signals, a slower one will produce delayed but more reliable signals.
Fastest: don't wait for a SuperTrend confirmation, only wait for a divergence confirmation. Lot of false positives.
Fast: wait for a fast SuperTrend confirmation (SuperTrend factor = 1).
Medium: wait for a slower but more reliable SuperTrend confirmation (SuperTrend factor = 2). Fewer false positives but more lagging signals.
Slow: wait for an even slower but very reliable SuperTrend confirmation (SuperTrend factor = 3). Very few false positives but very late signals.
Time frames
You can define the higher time frames you wish to use here.
Default values try to adhere to a x6 to x8 ratio, x4 to x12 at maximum.
Some pairs are more significant than others, like 4 hour + daily, daily + weekly and weekly + monthly.
1 second: 10 seconds
5 seconds: 30 seconds
10 seconds: 1 minute
15 seconds: 2 minutes
30 seconds: 3 minutes
1 minute: 10 minutes
2 minutes: 15 minutes
3-4 minutes: 30 minutes
5-9 minutes: 45 minutes
10-11 minutes: 1 hour
12-14 minutes: 1 hour
15-29 minutes: 2 hours
30-44 minutes: 4 hours
45-59 minutes: 6 hours
1 hour: 8 hours
2 hours: 12 hours
3 hours: 1 day
4-5 hours: 1 day
6-7 hours: 2 days
8-11 hours: 3 days
12-23 hours: 4 days
1 day: 1 week
2 days: 2 weeks
3 days: 3 weeks
4 days: 1 month
5 days: 1 month
6 days: 1 month
1 week: 1 month
2 weeks: 2 months
3 weeks: 3 months
1 month: 6 months
2 months: 9 months
3 months: 12 months
4 months: 15 months
5 months: 21 months
6 months: 24 months
Time frames use the TradingView units:
s = seconds
h = hours
D = days
W = weeks
M = months
no unit = minutes
Time frame strings follow these rules:
They are composed of the multiplier and the time frame unit, e.g., “1S”, “30” (30 minutes), “1D” (one day), “3M” (three months).
The unit is represented by a single letter, with no letter used for minutes: “S” for seconds, “D” for days, “W” for weeks and “M” for months.
When no multiplier is used, 1 is assumed: “S” is equivalent to “1S”, “D” to “1D, etc. If only “1” is used, it is interpreted as “1min”, since no unit letter identifier is used for minutes.
There is no “hour” unit; “1H” is not valid. The correct format for one hour is “60” (remember no unit letter is specified for minutes).
The valid multipliers vary for each time frame unit:
- For seconds, only the discrete 1, 5, 10, 15 and 30 multipliers are valid.
- For minutes, 1 to 1440.
- For days, 1 to 365.
- For weeks, 1 to 52.
- For months, 1 to 12.
Styles
You can configure the appearance of the Bollinger Bands, the overbought / oversold background, the divergences and the signals here.
Advanced - MACD
Settings used for the MACD divergences. You most likely won't need to change these values, especially if you need them to be explained.
Advanced - MFI
Settings used for the MACD divergences. You most likely won't need to change these values, especially if you need them to be explained.
Advanced - RSI
Settings used for the MACD divergences. You most likely won't need to change these values, especially if you need them to be explained.
Advanced - SuperTrend
Settings used for the MACD divergences. You most likely won't need to change these values, especially if you need them to be explained.
ALERTS
Any signal: a bullish or bearish signal has been detected.
Bullish signal: a bullish signal has been detected.
Bullish signal with divergence: a bullish signal forming a divergence with a previous bullish signal has been detected.
Bearish signal: a bearish signal has been detected.
Bearish signal with divergence: a bearish signal forming a divergence with a previous bearish signal has been detected.
Overbought/oversold = asset price is outside of the Bollinger Bands' main channel.
Strongly overbought/oversold = asset price is outside of the Bollinger Bands' outer bands.
Current time frame - Entering overbought: asset is now overbought at the current time frame.
Current time frame - Exiting overbought: asset is not overbought anymore at the current time frame.
Current time frame - Entering strongly overbought: asset is now strongly overbought at the current time frame.
Current time frame - Exiting strongly overbought: asset is not strongly overbought anymore at the current time frame.
Current time frame - Entering oversold: asset is now oversold at the current time frame.
Current time frame - Exiting oversold: asset is not oversold anymore at the current time frame.
Current time frame - Entering strongly oversold: asset is now strongly oversold at the current time frame.
Current time frame - Exiting strongly oversold: asset is not strongly oversold anymore at the current time frame.
Higher time frame - Entering overbought: asset is now overbought at the higher time frame.
Higher time frame - Exiting overbought: asset is not overbought anymore at the higher time frame.
Higher time frame - Entering strongly overbought: asset is now strongly overbought at the higher time frame.
Higher time frame - Exiting strongly overbought: asset is not strongly overbought anymore at the higher time frame.
Higher time frame - Entering oversold: asset is now oversold at the higher time frame.
Higher time frame - Exiting oversold: asset is not oversold anymore at the higher time frame.
Higher time frame - Entering strongly oversold: asset is now strongly oversold at the higher time frame.
Higher time frame - Exiting strongly oversold: asset is not strongly oversold anymore at the higher time frame.
Dual time frame - Entering overbought: asset is now overbought at current and higher time frames.
Dual time frame - Exiting overbought: asset is not overbought anymore at current and higher time frames.
Dual time frame - Entering oversold: asset is now oversold at current and higher time frames.
Dual time frame - Exiting oversold: asset is not oversold anymore at current and higher time frames.
Dual time frame - Entering strongly overbought: asset is now strongly overbought at current and higher time frames.
Dual time frame - Exiting strongly overbought: asset is not strongly overbought anymore at current and higher time frames.
Dual time frame - Entering strongly oversold: asset is now strongly oversold at current and higher time frames.
Dual time frame - Exiting strongly oversold: asset is not strongly oversold anymore at current and higher time frames.
ABOUT THE HIGHER TIME FRAME BOLLINGER BANDS
Using a classical higher time frame Bollinger Bands would produce lagging data. For instance, if we are using a weekly BB at the daily time frame, we'll have to wait up to 7 days for the weekly bar to close to get the actual final weekly BB values. Instead, this indicator generates real time higher time frame Bollinger Bands by multiplying the moving average length of the Bollinger Bands by the higher time frame / current time frame ratio. For instance, a weekly BB in the daily time frame will use a x7 ratio (i.e. a 20 * 7 = 140 days MA BB).
It produces slightly different but very similar bands that are as meaningful and can be used in real time at lower time frames.
Alternatives would have been to wait up to seven days for signals to be finalized, which would have render them meaningless. Or to use previous week data, which would have made the signal inaccurrate.
To sum up, weekly Bollinger Bands use a 20 weeks moving average updated one time a week. In the daily time frame, this indicator also use a 20 weeks (140 days) moving average but updated daily instead of weekly.
A comparison between a traditional higher time frame Bollinger Bands vs the ones used by this indicator:
Blue and orange lines are the actual weekly BBs, grey ones are the daily updated ones.
ABOUT THE DIVERGENCES
This indicator uses the same divergences algorithm as my other indicators:
- RSI with divergences
- MACD with divergences
- Trend Reversal Indicator
You'll find more information about this algorithm on my RSI page.
Scalp Pump-Dump Detector with AlertsThis script displays the percentage of movement of all candles on the chart, as well as identifying abnormal movements to which you can attach alerts. An abnormal movement is considered a rise or fall that exceeds the parameter set in the settings (by default, 1% per 1 bar).
Added a function to display the volume on abnormal candlesticks.

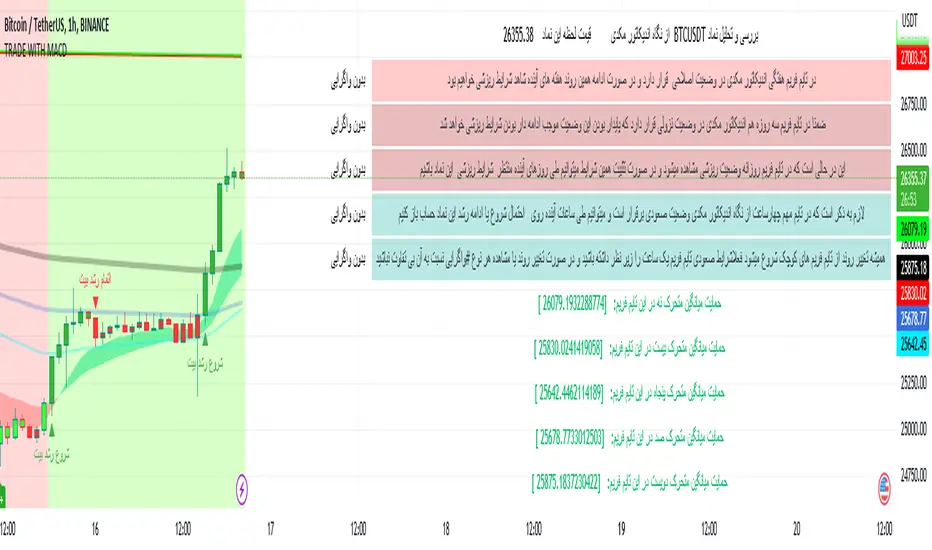
TRADE WITH MACDThis indicator is used to identify the trend through the background color and by using the MACD indicator information and summarizing the moving average information and identifying the trend through the integration of information and then warning the fall and growth of the price of Bitcoin relative to the successful entry into any transaction by the trader. it helps
Some features of this indicator:
- The table draws the time frames in the desired time period quickly and accurately
- Identifying and inserting ascending and descending trends
- View the chart of five moving averages (9, 20, 50, 100, 200) at the same time
- Draw charts automatically or draw a chart with the desired interval length and desired start time
- Automatic updating of price data charts
- Changing the background color and warning in separate time frames from the current time frame as desired by the trader
RSI-CCI Fusion + AlertsThe "RSI-CCI Fusion" indicator combines the Relative Strength Index (RSI) and Commodity Channel Index (CCI) from TradingView.
RSI-CCI Fusion: Unlocking Synergies in Technical Analysis
Technical analysis plays a crucial role in understanding market dynamics and making informed trading decisions. I often rely on a combination of indicators to gain insights into price movements and identify potential trade opportunities. In the lines below, I will explore the "RSI-CCI Fusion" indicator, a powerful tool that combines the strengths of the Relative Strength Index (RSI) and the Commodity Channel Index (CCI) to provide enhanced trading insights.
1. Understanding the RSI and CCI Indicators
Before delving into the fusion of these indicators, let's briefly review their individual characteristics. The RSI is a widely used momentum oscillator that measures the speed and change of price movements. It oscillates between 0 and 100, with readings above 70 indicating overbought conditions and readings below 30 indicating oversold conditions.
On the other hand, the CCI is a versatile indicator designed to identify cyclical trends in prices. It measures the distance between the price and its statistical average, thereby providing valuable insights into overbought and oversold levels.
2. The Concept of RSI-CCI Fusion
The RSI-CCI Fusion indicator is born out of my desire to harness the collective power of the RSI and CCI. By combining these indicators, I can benefit from a more comprehensive trading signal that captures both momentum and cyclical trend dynamics.
The fusion process involves assigning weights to the RSI and CCI, creating a blended indicator that reflects their relative importance. The weighted combination ensures that both indicators contribute meaningfully to the final result.
To maintain consistency, the RSI and CCI values are standardized using the z-score technique. This normalization process brings the values to a common scale, making them directly comparable. Rescaling is then applied to bring the combined indicator back to its original scale, facilitating intuitive interpretation.
3. Interpreting the RSI-CCI Fusion Indicator
When plotting the RSI-CCI Fusion indicator on a chart, I gain valuable insights into market dynamics and potential trading opportunities. The indicator's plot typically includes dynamic upper and lower bands, which are calculated based on the indicator's standard deviation. These bands provide boundaries for evaluating overbought and oversold conditions.
When the RSI-CCI Fusion indicator crosses above the lower band, it suggests oversold conditions and potential buying opportunities. Conversely, when the indicator crosses below the upper band, it indicates overbought conditions and potential selling opportunities. I also pay attention to the baseline, which represents the neutral level and may signal potential trend reversals.
4. Utilizing Alerts for Trading Decisions
The RSI-CCI Fusion indicator can be further enhanced by incorporating alerts. These alerts notify me when the indicator generates buy or sell signals, enabling me to take prompt action. I can customize the alerts based on my preferred thresholds and timeframes.
However, it is crucial to remember that the RSI-CCI Fusion indicator should not be relied upon in isolation. To increase the robustness of my trading decisions, it is recommended to combine the indicator with other analysis techniques such as trend lines, support and resistance levels, or additional indicators. This convergence of analysis methodologies enhances the overall accuracy of my trade signals.
Conclusion: The RSI-CCI Fusion indicator represents a compelling approach to technical analysis by synergizing the strengths of the RSI and CCI. By combining momentum and cyclical trend dynamics, I gain a more comprehensive view of market conditions. The fusion of these indicators, accompanied by timely alerts, equips me with valuable insights and facilitates well-informed trading decisions.
As with any technical analysis tool, it is essential for me to backtest the RSI-CCI Fusion indicator to evaluate its performance across different market conditions and timeframes. Additionally, applying proper risk management strategies is crucial to ensure consistent and disciplined trading practices.

TrendLine I3-TLIdea:
Draw a trendline that can set an alert every time the price cross over/under.
Concept:
(Note that we take the close to get the closing price).
-Determine the coordinates of 2 points of the line AB: A(x1;y1); B(x2;y2).
-Apply Oxy geometry to the chart with price as Oy axis, time as Ox axis. Use linear equations to determine:
+If point's x > line's x, the point is to the right of the line.
+If point's x < line's x, the point is to the left of the line.
+If point's x == line's x, the point is on the line.
-Determine when the price is crossOver or crossUnder the trend line, display that time on the chart and send an alert.
How it works:
1. Input value to config the line by manually:
- Y1: Price 1 as point 1.
- X1: Time at point 1.
- Y2: Price 2 as point 2.
- X2: Time at point 2.
X2 (To date) must be after X1 (From date).
Please consider time (hour, minute) if timeframe < 1hour.
Then draw a line on the pouring table with straight line AB as solid line, extended line as broken line. Logic will start from dashed line (To date in input).
If the price changes value from side to side of the line, show the text label, change the background color accordingly (blue top, red bottom),
also sends an alert ("CrossUnder"; "CrossOver").
2. The indicator's operating range is limited to 500 bars from the "From date" bar. When reaching to the outside, it will show a yellow warning with outbound message.
3. Set alert for this indicator, it will send alert follow 1. condition.
Suitable time frames:
5m, 15m, 1h, 4h, 1D
* Please note that this logic does not attempt to predict future prices or 100% accurate signal.
This is FREE indicator.
(Please direct message or visit website if you want to try another invite-only indicators)
Hope you guys enjoy!
Examples:
GOLD 1D
EURUSD 1H

Color Changing MACDJapanese below / 日本語説明は下記
This indicator shows MACD with its colors changing based on trend strength.
The purpose of this indicator is to visually understand phases of trends, which are beginning, advancing and ending, measuring the range between MACD line and signal line.
Since MACD is originated from moving average, the range between MACD line and signal line gradually expands as trends progress while the range gets narrowed as trends come closer to the end. The indicator visualizes this characteristics.
The colors change as follows:
Green: In bullish trend, the range between MACD and signal gets expanded from previous candle, which indicates up trends continue
Purple: The range between MACD and signal gets narrowed from previous candle, which indicates trends gradually come to end.
Red: In bearish trend, the range between MACD and signal gets expanded from previous candle, which indicates down trends continue
See the chart below.
Features
Coloring
MACD line and signal line's colors change according to the logic above.
You can also fill the gap between MACD line and signal line with the same color changing logic as lines.
Signals
Golden cross and death cross signals can be displayed.
Alert
Alerts can be set when golden and death crosses occur.
---------------------
トレンドの強弱で色が変わるMACDのインジケーターです。トレンドが初期、進展期、終了期と移り変わる様子を視覚的に判断できることを目的に開発しています。
トレンドの強弱はMACDラインとシグナルラインの幅で判断します。
MACDは移動平均線を元にしたインジケーターであるため、トレンドが進展するにつれMACDラインとシグナルラインの幅は徐々に広がります。一方で、トレンドが終盤に差し掛かかるにつれ上記の幅は狭まります。インジケーターはこのMACDの特徴を色で可視化します。
色は以下の通り変化します。
緑:上昇トレンドにおいて、MACDラインとシグナルラインの幅が前のローソク足のそれよりも拡大している場合
=>トレンドの勢いが強まっていることを示唆
紫:MACDラインとシグナルラインの幅が前のローソク足のそれよりも縮小している場合
=>トレンドの勢いが弱まっていることを示唆
赤:下降トレンドにおいて、MACDラインとシグナルラインの幅が前のローソク足のそれよりも拡大している場合
=>トレンドの勢いが強まっていることを示唆
サンプルチャート
機能
色変更
上記のロジックでMACDとシグナルラインの色を変更します。また両ラインの間をラインと同じロジックで塗りつぶすことも可能です。
シグナル
ゴールデンクロスとデッドクロスでシグナルを表示
アラート
ゴールデンクロスとデッドクロスでアラートを設定可能

TradeBee Percent Gap AlertA simple script to enable adding a trigger when a stock reaches 'X' percent, the 'X' can be configured.
The script also displays current tickers gap %, this is particularly helpful when you have 2 or more panels on a chart

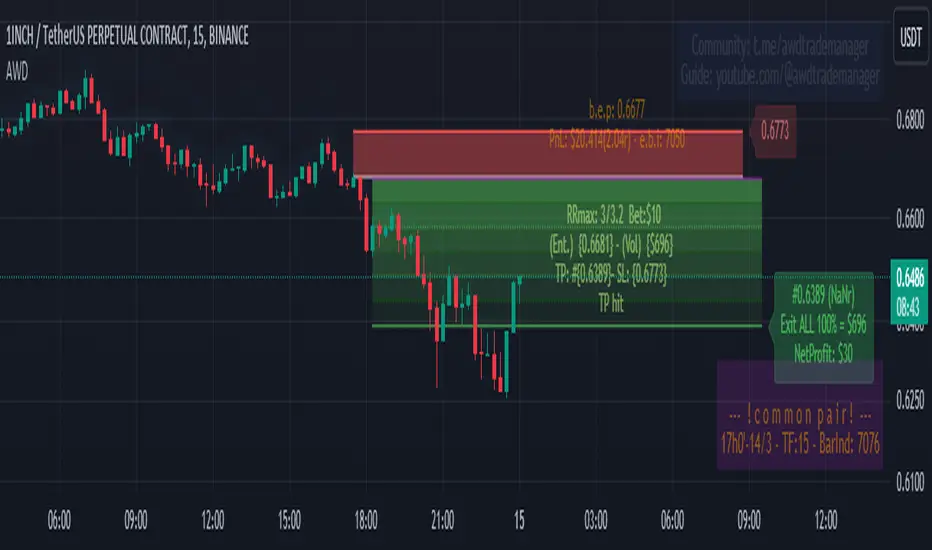
AWD TRADE MANAGER (ATM) by ManhDNAWD TRADE MANAGER (ATM) is a position management tool including with some advanced features and entry suggestions. It helps you to do most of position calculations and position management, reduce time spent for charting by alerts.
There are 3 main things to describe about the manager:
(1) The original function of the manager is to help traders to manage their trades with automatic calculations of all factors of their trades with some of input values. For example, it will calculate the trade volume when you enter the bet size, entry and stop loss price. It calculates take profit price when you enter entry, stop loss prices and the risk/reward ratio, …
(2) Another function is the system of alerts. After set up a trade, create an alert and the manager will do the rest. It will send you an alert when the limit order got filled, got stopped out, take profit level hit, or even it reached a key level or an opposite/spike move just occurred…
(3) Entry suggestions: Suggest entries with price action strategies. Details bellow.
Features in details:
(1) Automatic calculations:
- Auto calculate trade volume based on entry, stop loss prices and the money users willing to lose when the trade is failed. Auto detect some type of assets and volume will be calculated in USD (for cryptocurrencies) or in lot (for forex).
- Auto calculate take profit price based on entry, stop loss prices and expected rr ratio.
-Auto suggest take profit price based on pivot points.
- Auto suggest stop loss price based on pivot points.
- You can enter several exit points with percentages and the manager will calculate the averaged risk reward ratio you earned after the last exit price reached.
- Quick entry price pick to reduce typing requirement.
- Quick trade set up: 2 checkboxes and 1 number entering to set up a trade.
(2) Alert system
After setting up a trade and creating an alert of the manager, it will follow the market and your order. It will send you alerts for all the events that you should follow up your position. These alerts can be sent to your pc, your phone and your smart watch, so even you are a full-time day trader, you will save your time for charting or managing your positions. Here’s the list of alerts:
- Sending alert when suggesting an entry with details calculated from preset inputs so you can just pick that info to enter the position including trading volume, entry, stop loss, take profit prices, timeframe, estimated risk-reward ratio …
- Sending alert when a limit order got filled and auto switch to position-managing-mode.
- Sending alert when a limit order in still staying unfilled but should be canceled (because of price reaching a key level or is running too far, …)
- Sending alert when the position got stopped out or TP hit.
- Sending alert when the running position reached a key level and need to be watched out.
- Sending alert when a spike move or opposite move just occurred.
- Sending alert when a position is taking too long to run.
- You can also set 3 levels of price with messages then ATM will send you alerts when price reaches those levels.
- When price runs, ATM might suggest you to move stop loss to levels based on pivot points by sending you alerts.
- Alert when a BOS occurred.
- Options to turn on/off each kind of alert.
(3) Entry suggestions.
The script included price action entry suggestions.
The 1st strategy is getting in a position when a candle pattern occurred and confirmed by MA20.
The 2nd strategy is detecting double top/bottom and a candle pattern confirm break out after that.
The 3rd strategy is a pullback strategy, in a trending market, a candle pattern occurs and confirms the pullback ends, it will suggest an entry.
All those strategies I am using by myself for a long period of time but to make sure they are good for your trading style, do your own research and backtest before use. Keep in mind to manage risk and be responsible to your capital.
User side modifications:
- Those price action strategies have some major arguments that users can tune themselves to make it meet their style or their needs like choosing method to suggest entries, refine entry quality by changing the confirmation methods,…
- Most of appearance factors can be changed by users.
- one-click to toggle between full features and simple mode.
TradingView Chart demo pictures:
Author's bio:
I have been a full-time day trader for 7 years. I like coding with Pinescript and I also developed some helpful indicators that provide unique aspects to approach markets and the most favorite one from that is Relative Volume Index (RVI) that will be introduced in near future.
Disclaimer:
This tool has been tested and been using for my own trading career for a long period of time but practicing to use it yourself to understand it and use it correctly is needed. All of the features have been carefully tested before publishing but make sure to double-check all the info you get from it before getting into a trade to avoid losing money by a sudden mistake or even a bug. Keep in mind you will need to take all the responsibility with your capital or any potential loss while using this tool.
If you get anything wrong while using it, please leave some comments bellow, all of your ideas or suggestions will be taken seriously.
Thank you in advance!
(It is not possible to explain all the settings or features within the description, If you have questions, please leave comment, I will answer to help you to get familiar with the tool.)
BTC 4h bot 2.0 AlertsThis is Alert version of BTC 4h bot 2.0.
Optimized for pairs BTC vs stablecoins, 4h timeframe.
HOW IT WORKS:
Script is based on the fact that there are certain phases of the market when there is a greater probability that BTC will go to one side or the other. To evaluate which phase we are in, the script uses "Main trend" and "Confirmation signals".
Main trend
- Is composed of a combination of several supertrends and moving averages. A Supertrend is a trend following indicator that helps in identifying whether we are in an uptrend or a downtrend. A higher factor is used to capture the main trend and not just small movements. In case the market goes sideways, the Supertrend does not work well, so it is a combination of multiple supertrends along with moving averages to differentiate a real strong trend from a range.
- It can be seen on the graph as a thick solid line.
- In an uptrend is green, in a downtrend red, gray represents the neutral zone.
Confirmation signals
- Are several script-evaluated indicators such as RSI , MACD , ADX and others, which serve to confirm the trend. In this case, it is the opposite way to the Main trend. Confirmation signals are used here to detect small movements. They are trying to capture bullish and bearish price momentum.
- On the graph they are seen as dashed lines above or below the Main trend (in the gray zone they are in the middle).
- It indicates only two signals, green for buy and red for sell.
HOW TO USE IT:
if the Main trend and Confirmation signals are of the same color, it will send a buy or sell signal, depending on which phase of the trend it is in. If the Main trend is e.g. in an uptrend and the market is going up, Confirmation signals should generate a lot of signals. But if the market starts to go in the opposite direction, Confirmation signals should generate fewer signals or none at all, thus reducing the number of wrong trades. In the gray zone of the Main trend it does not open positions.
To close position is possible to use stop loss and take profit or alternative could be to set very high TP value, thereby letting the script close the positions by itself by Stop Long or Stop Short.
The recommended setting is:
TP: 3.9%
SL: 4.7%.
In this case, it is a Alert version, where can be seen all the signals, which the script generates.
Green triangels indicate open Long.
Red triangels indicate open Short.
Small blue triangels indicate Stop Long position.
Small orange triangels indicate Stop Short position.
Signal is valid after bar is closed, so do not open a position before.
Script works well on Bitstamp, but also other exchanges with pair BTC/USD or BTC/stablecoins.
The script works consistently well over a long period of time, using past probabilities, but this does not guarantee future results.
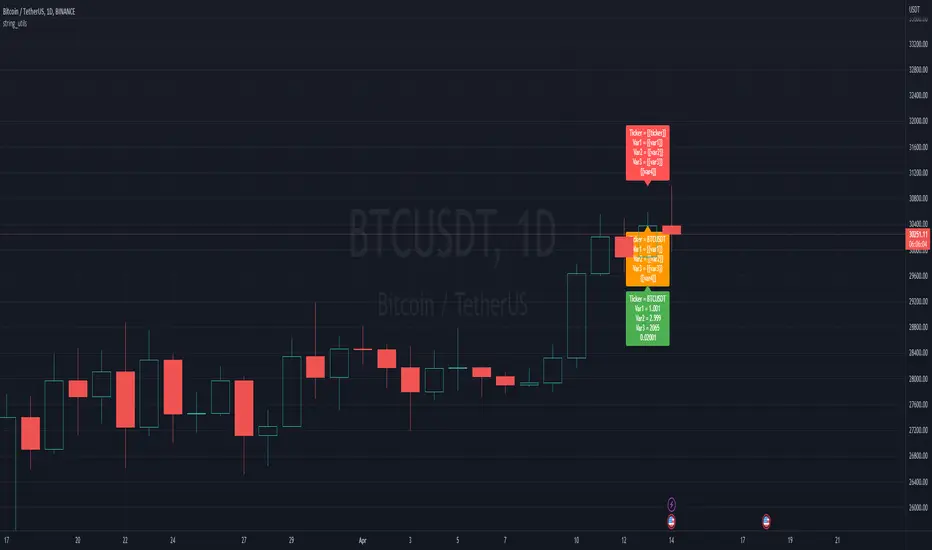
string_utilsLibrary "string_utils"
Collection of string utilities that can be used to replace sub-strings in a string and string functions
that are not part of the standard library.
This a more simple replacement of my previous string_variables library since it uses types for better
performance due to data locality and methods that give a more intuitive API.
Detect BOS in Five Candles with MTF - Alert [MsF]Japanese below / 日本語説明は英文の後にあります。
-------------------------
*This indicator is based on azmathshah's "Last Three Candles each of Two HTF".
It's a very cool indicator. thank you.
You can detect trend reversal with candlesticks.
It's MTF compatible and can display up to 2 sets of 5 candles of any time frame on the right side of the chart.
By displaying the candles of the upper time frame bars, you can check the trend change and measure the entry timing with the lower time frame bars.
There are two types of alerts.
"Liquidity Sweep": This is an alert when the upper beard (high) of ③ is touched with the next foot.
"Candle Close": An alert when the upper whisker (high) of ③ is exceeded by the closing price of the next bar (generally a strong signal)
-------------------------
ローソク足でトレンド転換を検知するインジケーターです。
MTF対応となっておりチャートの右側に任意タイムフレームのローソク5本を最大2セット表示できます。
上位足のローソクを表示することにより、トレンド転換確認しながら、下位足でエントリータイミングを計ることができます。
アラートは2種類あります。
"Liquidity Sweep":③の上ヒゲ(high)を次の足でタッチした場合のアラートです
"Candle Close":③の上ヒゲ(high)を次の足の終値で上回った場合のアラートです(一般的には強力なシグナルとなります)

Take Session High/Low Alert [MsF]Japanese below / 日本語説明は英文の後にあります。
-------------------------
This indicator that displays High/Low lines for each session. The Key Levels of each session can be visually recognized, which is useful for PD Array analysis. You can display the last 3 days. Based on trinity by ICT.
The biggest feature is that the color shape of the line changes when reaching High/Low. Of course, you can also set alerts.
Unreached High/Low lines can be extended to the right. hides all timeframes over 1 hour. (alert is alive)
You can choose 4 sessions. If you only want to use 3 sessions, you can do that by setting the same session time for 2 of the 4 session settings.
About Parameter Settings
Session Time: Please set it to be a 24-hour cycle. You can also specify the time zone. The default is NY time.
Basis/Other color: The first time specified in "Session Time" in this indicator's parameter is the "Basis color". "Other color" is a line other than that.
Enable Time Lines: You can turn on/off the display of vertical lines.
High/Low color: High/Low line setting that has not been reached.
Taken color: High/Low line setting that has already been reached.
Extend Lines: Allows unreached High/Low lines to be extended to the right in the chart.
-------------------------
セッションごとのHigh/Lowをライン表示するインジケーターです。
過去約3日分を表示することができます。
最大の特徴はHigh/Low到達時にラインの色形が変わることです。もちろんアラート設定も可能です。
未到達のHigh/Lowラインは右側に延長することができます。
チャート表示がビジーとなる為、1時間を超える時間足ではすべて非表示とする仕様です。(アラートは生きてます)
セッションは4つ指定できます。
もしセッションを3つのみ使用したい場合は、4つのセッション設定の内2つに同じセッション時間を設定することで実現可能です。
■パラメータ設定
Session Time:24時間周期となるように設定してください。またタイムゾーンが指定できます。デフォルトはNY timeです。
Basis/Other color:パラメータの"Session Time"にて一番最初に指定した時間が基準=Basisとなります。Otherはそれ以外のラインとなります。
Enable Time Lines:垂直ラインの表示ON/OFFが可能です。
High/Low color:未到達のHigh/Lowライン設定となります。
Taken color:到達済みのHigh/Lowライン設定となります。
Extend Lines:未到達のHigh/Lowラインを右に延長できます。
