Box Range AlertSimple Script for getting alerts on the crossing of Upper & Lower levels either way.
Good for Free users as they can only use 1 alert at a time. So this indicator will be useful to get alerts on both Breakout Or Breakdowns.
Just add input Price manually and set alerts.
Alert

MTF CCI with timeframe control function and signal/alertJapanese below. / 日本語説明は下記
Summary
This indicator shows CCI of the current timeframe and another CCI from upper timeframe as MTF CCI with ability to show signals and set alerts when crossing upper/bottom bands.
For general use of CCI, please refer to the link below(by TradingView)
jp.tradingview.com
How is it different from other MTF CCI indicators?
Problems with other MTF CCI indicators are;
-If you set higher timeframe CCI(MTF CCI), it will also be shown on further higher time frames.
i.e. If you set 4hour chart’s CCI on 1 hour or lower time frame charts, it will also appear on daily and weekly chart, which is not necessary.
To tackle these problems, this indicator has incorporated functions below.
-To be able to control timeframes where MTF CCI is displayed to eliminate unnecessary information when you open higher time frame’s charts.
For example, if you select daily timeframe for MTF CCI, the CCI will be shown only on 4 hour or lower timeframes.
These are the values added on this indicator.
Specifications
-This indicator shows one CCI from the current timeframe and another CCI from another timeframe(MTF).
-For MTF CCI, you can select upper timeframe from monthly, weekly, daily, 4hour, 1hour, 30mins, 15mins, 5mins.
Again, if you select weekly for MTF, for instance, then MTF CCI will be displayed on daily or lower timeframes. Other timeframes work same.
-For both CCI(current timeframe) and CCI(MTF), signals will be shown when they cross over/under upper band and lower band, which you can control display on style tab of the indicator.
-Alert can be set same as signal conditions.
Please see the sample chart below.
Brown triangle is signal for CCI(current timeframe) and maroon signal is for MTF CCI.
--------------------------------------------------------------------------------------------------
現在時間軸のCCIと上位足のCCIを表示するマルチタイムフレームCCI(MTF CCI)インジケーターです。アッパーバンド、ロワーバンドと交差した時にシグナルを表示するとともに、アラートの設定も可能です。
CCIの一般的な使い方は以下のリンク(TradingView)を参照ください。
jp.tradingview.com
他のマルチタイムフレームCCIとの違い
他のマルチタイムフレームCCIのインジケーターでは、以下の問題に直面します。
・上位足のCCIを表示すると、さらに上位足でもそのCCIが表示され見にくくなる。
例: 4時間足のCCIを下位足で表示可能な様に設定すると、日足や週足でも表示され、チャートがノイズだらけに・・・
この問題に対して、このインジケーターでは、
・上位足のCCIを表示する時間軸を制御することで上位足で不必要な情報を表示させない。
という機能を加えることでこれらの問題を解決しています。
機能概要
・このインジケーターでは現在の時間軸のCCIと上位足から一つのCCIを表示します。
・上位足は月足、週足、日足、4時間足、1時間足、30分足、15分足、5分足から選択することが可能です。
・上位足のCCIは選択した時間軸未満の時間軸に表示されます。
例:
日足のCCI : 4時間足、1時間足、30分足、15分足、5分足、1分足チャートにのみ表示
4時間足のCCI : 1時間足、30分足、15分足、5分足、1分足チャートにのみ表示
・上位足のCCIは選択した時間軸未満の時間軸に表示されます。
・現在時間軸のCCI、MTF CCIともに、アッパーバンド/ロワーバンドと交差したタイミングでシグナルを表示することができます。(アッパーバンド/ロワーバンドそれぞれに対して上に交差、下に交差のタイミングで表示されます。不要なものはスタイル設定画面で非表示とすることができます。)
・シグナルは設定画面で表示・非表示の切り替えができます。
・シグナルと同じ条件でアラート通知の設定が可能です。
サンプルチャート
1時間足に4時間足のCCIを表示したものです。茶色の三角が現在時間軸のCCIのシグナル。赤の三角がMTF CCIのシグナルです。

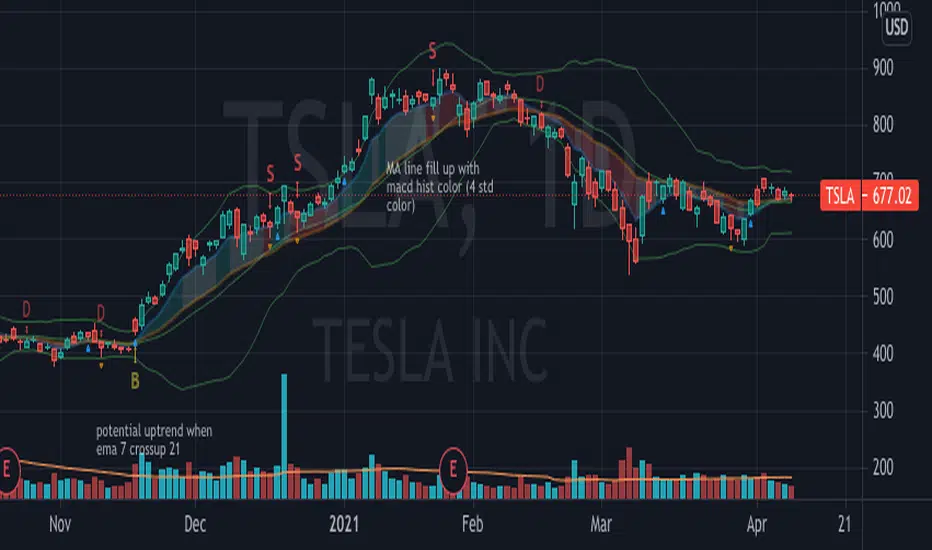
EMA CrossoversUseful for identifying and receiving alerts about uptrends and downtrends.
This script uses two Exponential Moving Averages (EMAs) to find price uptrends and downtrends. An Exponential Moving Average (EMA) is a type of moving average that places a greater weight and significance on the most recent data points. The script produces uptrend and downtrend signals based on crossovers and divergences between the two EMAs, the user will be able to spot a trend change (when the EMAs crossover) and to determine the strength of the current trend (when the EMAs diverge). It is also posible to get alerts for uptrends and downtrends on the web and mobile app with sound and pop-ups as well as via email. The optimal time to enter and exit the market can be concluded from this trend changes.
The user can set their own EMAs, by default they are set to 21 and 55 periods for medium and long term respectively. When the medium term EMA crosses below the long term EMA the asset is in a downtrend and the price will decline, and when the medium term EMA crosses above the long term EMA the asset is in an uptrend and price will increase.
This scripts plots the following indicators and signals on the chart to help the user to identify trends:
1.- Medium and long term EMAs as lines overlaid on the price chart.
2.- Up green triangles above bars when the price is on an uptrend and down red triangles below bars when the price is on a downtrend.
3.- Arrows with text to indicate the start of an uptrend or downtrend.
The user can enable and disable the indicators and signals as well as set colors and shapes to their liking.
This script also lets the user create alerts for uptrends and downtrends. To create a new alert using this script follow this instructions:
1.- Once you added this script to your chart, go to the alerts panel (right on web or bottom tool bar on the mobile app) and add a new alert (alarm clock icon with a plus sign).
2.- A modal window will open. On the “Condition” dropdown menu select “EMA Crossovers”.
3.- On the next dropdown menu (right below the “Condition” one) you can select from two types of alerts “Uptrend started” and “Downtrend started”.
4.- Lastly you can set all the normal alert options and create the alert.

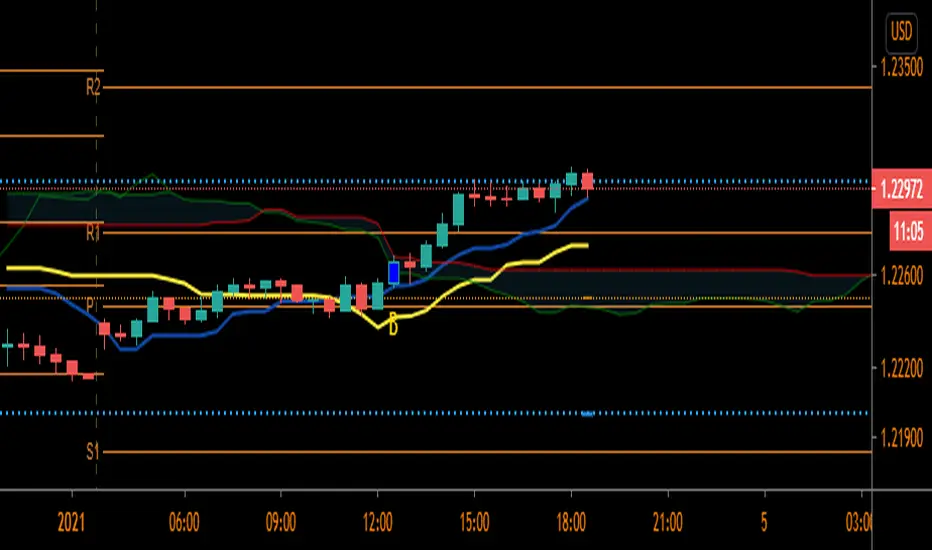
Ichimoku Alert Indicator Buy Sell Please Take Trade as per your own risk.
Hi, this my new script which show you correct Ichimoku signals, when price exit cloud.
SELL SIGNAL:
- red line below blue
- green line below price
- price exit cloud bottom
- price below 3 EMA's!
BUY SIGNAL:
- red line above blue
- green line above price
- price exit cloud upper
- price above 3 EMA's!
You can change ichimoku parameters and input 3 EMA's. If u dont want use any of the EMA's then input 1 into them.
Comments
Bjorgum RSIRSI output signals are displayed with color change to reflect the plotted value. This makes evaluating RSI conditions require but a glance.
RSI momentum buy signals are given on the cross of the 50 level, whereas sell signals are given on a fall below.
Default values a 5 period RSI which gives more timely entrances and exits for swing traders. This can be adjusted to the typical 14 period if the viewer desires slower signals.
Bullish and bearish area is shaded to accentuate the signal to the eye.
Excellent results can be found when coupling BJ RSI, with BJ TSI, and the reversal system using all 3 as a complete together simultaneously
Default color changes are plotted as a recorded value falls within the following levels:
RSI < 30 = green
RSI 30-50 = red
RSI 50-70 = blue
RSI 70-80 = yellow
RSI 80-90 = orange
RSI 90-100 = white hot

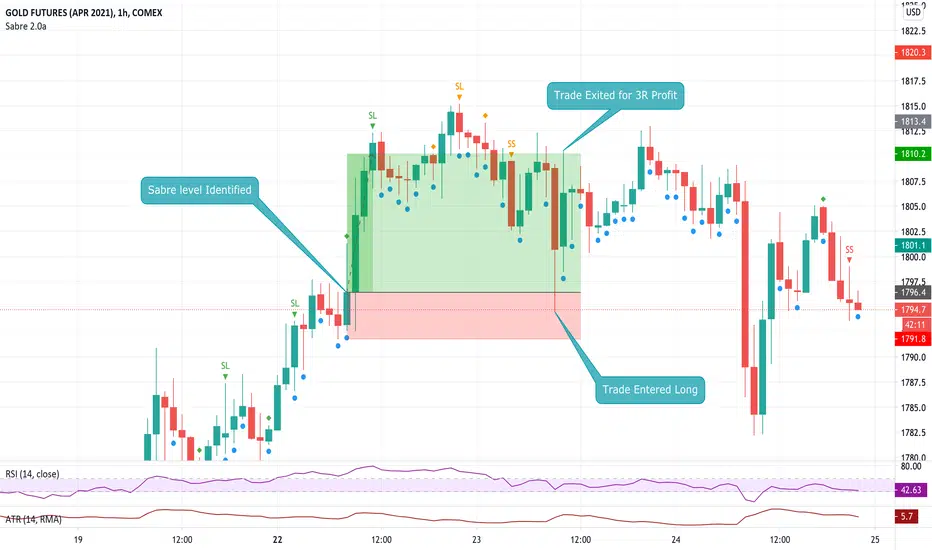
Sabre S&D Level LocatorThis indicator identifies high probability areas of levels of Supply and Demand where the potential of unfilled institutional orders is likely to result in a successful trade following the Sabre Trading System as taught by Anthony Navarro. This is a private Invite-Only script to be shared among members of the Sabre trading community.
The indicator paints a green dot at the origin of a strong move followed by two successive higher highs or lower lows. If the move out candles are all the same color, the origin candle gets a green dot. If the move out candles are not all the same color, they get an orange dot. Basing candles showing price stability where orders are being processed are indicated by a blue dot.
Cyatophilum Scalper [ALERTSETUP]This indicator comes with a backtest and alert version. This is the alert version. Its purpose is to create low timeframe and scalping strategies, by choosing from a list of built-in entry points which are described in detail below, and by configuring a risk management system to your liking.
Before diving into the entry points, I will explain the strategy and risk management settings.
These 3 settings allow to choose your strategy direction, and main behavior.
- Go Long ↗: activate or deactivate long entry points.
- Go Short ↘: activate or deactivate short entry points.
- Reversal strategy ↗↘↗↘: Activate this option will allow trades to reverse position from an opposite entry point. Keep it deactivated and trades will either wait a TakeProfit(TP) or StopLoss(SL) to be closed. When neither SL nor TP or set, this option is automatically activated.
StopLoss settings:
Both Long and Short SL can be activated and configured.
The base % price is the starting point of the stoploss, in a percentage of current price.
Trailing stop, when activated, works with 2 settings:
- % Price to Trigger: a percentage of current price the price should move in a bar to trigger a trailing movement.
- % Price Movement: the stoploss variation in a percentage of current price that moves on each bar.
TakeProfit settings:
Both Long and Short TP can be activated and configured.
The base % price is the value of the TP, in a percentage of current price.
Trailing Profit Deviation %: Percent deviation for the trailing take profit.
DCA:
DCA stands for Dollar Cost Average. The idea is to open additional orders from the base order so as to improve risk management.
These additional orders are also called Safety Orders. The indicator can handle up to 9 safety orders.
The strategy will exit either from a take profit based on percentage from base order or from a total volume percentage (Configurable in the parameters).
The steps spacing (space between each step) and safety orders volume (order size) can both scale by adding a scale multiplier.
By choosing from the base strategy dropdown menu, the indicator will generate entry points.
1. BUY SELL:
-> Low timeframes spot trading, with simple buy and sell orders.
How it works:
The indicator used is a combination of QQE (Atr based trend following indicator) and RMA 100 trendline.
I think the QQE does a great job in low timeframes because it is not impacted by the noise.
The RMA which is the moving average used in the RSI, will help giving confirmation to the entry points.
How to use:
It is meant to be used as a reversal strategy, but you can add a TP or SL if you want.
When comparing to Buy & Hold, make sure to deactivate the "Short results in the backtest" setting.
2. TREND SCALPING
-> A strategy for low timeframes trading.
How it works:
The strategy creates high volatility entries filtered by a duo convergence of adaptive trendlines (Adaptive HULL MA using the chart's resolution, Adaptive Tilson T3 using 1H resolution) and a higher timeframe (1H) RSI filter (long threshold: 70, short threshold: 40, RSI length: 10).
How to use:
Must be used on charts with a resolution smaller than 1H. Recommended: from 1m to 30m.
Must NOT be used as reversal strategy. Use it with a take profit and stop loss, and DCA if you can.
Sample risk management settings:
3. Support/Resistance BREAKOUTS
-> Trade low timeframes pivot points breakouts.
How it works:
The indicator calculates the 100 previous bars swing high and low. Any break above high or below low will trigger an entry point.
The entry is however filtered by an Adaptive Tilson T3 Trendline, an ADX 30 minimum threshold and a minimum average volume threshold.
How to use:
I recommend to click "Reversal" Strategy and set a Takeprofit target.
Find the best timeframe between 1m and 30m using the backtest version.
Example here with BTCUSDTPERP on 15m:
4. AGGRESSIVE SCALPING
-> Lots of trades in low timeframes.
How it works:
Created using Cyato AI, Higher/Lower Highs and Lows and 2 HULLMA crosses as entries, and 2 Adaptive Tilson T3 as trendfilter, a 25 ADX threshold filter and a volume filter.
How to use:
Recommended Risk Management settings: Takeprofit, Stoploss and DCA (Safety orders).
Find which timeframe work the best from 30 min and below. Should not be used above 30 min since this is the resolution for the MTF Tilson.
How to create Alerts:
Click Add alert, then select the indicator, and choose the alert for your order.
Most used alerts are "LONG ENTRY", "SHORT ENTRY" and "ALL EXITS".
You will find a description of each alert in the default alert message.
To gain access to this paid indicator, please use the link below.

Multi Time Frame Buy&Sell V4.0 [BACKTEST]Hi guys,this indicator Developed for Intraday and multi Time Frame Trading. Note: Invite only Script.Request to me Access permission to test this.
*** THIS IS STUDY VERSION ***
Time Frame : can use for 15 min / 30 min / 1h / 4h time
15 min configuration is best result for bitcoin and ethereum .
This can be used : Crypto Currency/ Bitcoins / ethereum ,Forex,currencies ,Index ,Commodity Gold / silver , Oil Market and in Equity / Futures
ETHUSDT Futures 15min
BTCUSDT Futures 15min:
GOLD /USD FOREX 15min:
HOW IT WORKS:
this indicator analyze EMA&SMA support and resistance then combine with pivot point and fibo levels is used to calculate the signals.and finally show entry label on
chart with target point and stop loss
HOW TO USE:
Creating a signal is as simple as adding the indicator called to your chart(buy or sell)label and background color change ( green=buy / red = sell)
green line is target and black line is stop loss.
in top of setting page you can see noise filter option . that can change it to get better result and reduce noise. in setting can set 3 target level and stoploss
NOT:all information show to info panel in chart.
strategy tester : enabled .All you can test this in live market in any segment.
NOT: can to change noise filter in setting setup until to get best result.
Choose any Date Month Year to Current Date and check the results below in the Strategy Tester.
REPAINT/NO REPAINT : No Repaint ,entery labal(buy or sell) and Background Color wont change. In the current candle position wait for the candle to close to see the
stability.
"Set alert": Select "Once per bar close" for your alert options.
There are 5 alerts:
- BUY
- SELL
- BUY OR SELL (for free TV users)
- take profit
- stop loss
Review and Feedback.Thank you!
Any issues report to me to Fix.Thank you!
how To Get access : Use the link below to obtain access to this indicator or PM us to obtain access.

Multi Time Frame Buy&Sell V4.0 [ALERTSETUP]Hi guys,this indicator Developed for Intraday and multi Time Frame Trading. Note: Invite only Script.Request to me Access permission to test this.
*** THIS IS STUDY VERSION ***
Time Frame : can use for 15 min / 30 min / 1h / 4h time
15 min configuration is best result for bitcoin and ethereum .
This can be used : Crypto Currency/ Bitcoins / ethereum ,Forex,currencies ,Index ,Commodity Gold / silver , Oil Market and in Equity / Futures
ETHUSDT Futures 15min
BTCUSDT Futures 15min:
GOLD /USD FOREX 15min:
HOW IT WORKS:
this indicator analyze EMA&SMA support and resistance then combine with pivot point and fibo levels is used to calculate the signals.and finally show entry label on
chart with target point and stop loss
HOW TO USE:
Creating a signal is as simple as adding the indicator called to your chart(buy or sell)label and background color change ( green=buy / red = sell)
green line is target and black line is stop loss.
in top of setting page you can see noise filter option . that can change it to get better result and reduce noise. in setting can set 3 target level and stoploss
NOT:all information show to info panel in chart.
strategy tester : enabled .All you can test this in live market in any segment.
NOT: can to change noise filter in setting setup until to get best result.
Choose any Date Month Year to Current Date and check the results below in the Strategy Tester.
REPAINT/NO REPAINT : No Repaint ,entery labal(buy or sell) and Background Color wont change. In the current candle position wait for the candle to close to see the
stability.
"Set alert": Select "Once per bar close" for your alert options.
There are 5 alerts:
- BUY
- SELL
- BUY OR SELL (for free TV users)
- take profit
- stop loss
To Get access - Send me a private chat message in tradingview.com to get access.Or request in comment section below.
Review and Feedback.Thank you!
Any issues report to me to Fix.Thank you!
Use the link below to obtain access to this indicator:

BTC & ETH Alert SystemWith Tradingview's free plan, only one alert is allowed. The purpose of this indicator is to allow for two alerts--one for BTC and one for ETH.
How to use the alert system:
1. Set the desired value for BTC and ETH that you want to be alerted for
2. Set an alert on the indicator by clicking the three ellipses and then "Add Alert"
3. Set the alert to go off if the value of the indicator is greater than 0.
The example is of BTC using an alert of $10,000 and an alert of ETH at $2,000 (untriggered)
The script can be easily modified to be used for different assets


SuperTrendRange by DGTSuperTrendRange study attempts to determine the state of the market
• whether a well-established bull/bear trend is present
• whether the market is trading in a range
SuperTrendRange (STR) takes into account the volatility of the market - further details regarding volatility can be found in the description of “Volatility Bands by DGT” study
Due to its similarities to SupertTrend (ST) and Parabolic SAR (SAR), I will try to explain by stating differences between them
SuperTrendRange uses both the ATR (Average True Range) and STDEV (Standard Deviation) as part of its calculations - unlike ST and SAR where they use only ATR
Sensitivity of the indicator is adjusted using the multiplier setting of both ATR and STDEV
Additionally, unlike ST, the source of the basis of SuperTrendRange can be selected among the assets price value or its moving average
Source and Length are adjustable too
The SuperTrendRange, like Parabolic SAR indicator, appears on a chart as a series of dots, either above, below or unlike Parabolic SAR both above and below of the asset's price
A dot placed
- below the price when the market is trending upward
- above the price when it is trending downward
- both above and below when the price starts moving sideways – this is a feature that both SuperTrend and Parabolic SAR misses, where they are known to produce false signals and losing trades, whereas SuperTrendRange emphasis the zones of the ranges occurring and in most cases are considered no trade recommended zones. Please note that the range width may vary depending on how the market is volatile. It is up to the users to trade if it fits their trading strategies
Dots plotted above and below can be assumed as Support and Resistance levels
Example usages – with trading opportunities
Gold Monthly Chart
Bitcoin Daily Chart
Disclaimer:
Trading success is all about following your trading strategy and the indicators should fit within your trading strategy, and not to be traded upon solely
The script is for informational and educational purposes only. Use of the script does not constitute professional and/or financial advice. You alone have the sole responsibility of evaluating the script output and risks associated with the use of the script. In exchange for using the script, you agree not to hold dgtrd TradingView user liable for any possible claim for damages arising from any decision you make based on use of the script

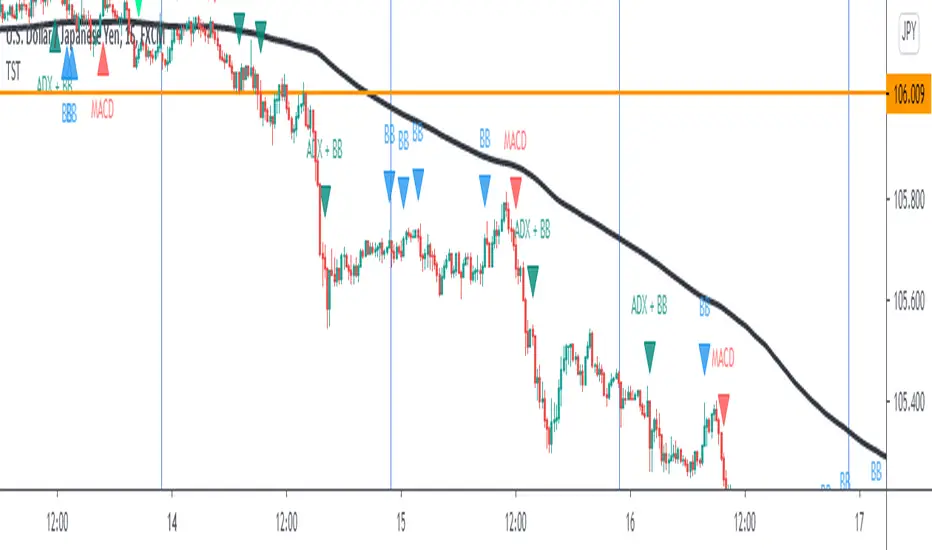
TST Signals & AlertsThis is an unofficial script for strategies tested on Trading Strategy Testing Youtube channel. Over time, most successful strategies will be added with an option to set strategy-specific alerts . TST Signals & Alerts will draw signals on the chart when the entry conditions are met. You can also opt for displaying indicators .
My script is meant for beginners but can be used by veterans too. Just pick one or two strategies, you don't want to flood your chart with conflicting signals. You may want to support your trades with a proper analysis. Is the market trending? Is there a fundament around the corner?
If a new signal occurs when there is still an open position, you are not supposed to take another.
The current version includes MACD and ADX + BB and BB strategies.
MACD strategy:
►Buy, when MACD crosses below the signal line when it is negative. The price must also be above 200 EMA.
►Sell, when MACD crosses above the signal line when it is positive. The price must also be below 200 EMA.
►This strategy was tested on 15-minute charts of EURUSD with reward-to-risk ratio 1,5 and win rate of 61% over 100 trades.
►►►MACD has to be added to your chart separately because it needs a new window. Ticking display indicators will not add MACD to your chart.
►►►MACD was also tested by a different channel I made a script for. You can view the results and the script here:
ADX + BB strategy:
►Buy, when the price is above 200 EMA and ADX becomes higher than 25.
►Sell, when the price is below 200 EMA and ADX becomes higher than 25.
►Stop-loss is either 200 EMA or Bollinger Bands level. Check the channel for more information.
►This strategy was tested on 5-minute charts of EURUSD, USDJPY, AUDUSD with reward-to-risk ratio 1,2 and win rate of 56% over 100 trades in total.
BB strategy:
►Buy, when the price is above 200 EMA and candle's low is below the lower Bollinger Band.
►Sell, when the price is below 200 EMA and candle's high is above the upper Bollinger Band.
►This strategy was tested on 15-minute charts of EURUSD with reward-to-risk ratio 1,5 and win rate of 52% over 100 trades in total.
►►►Due to the relatively low win rate of this strategy, you need to filter out potentially harmful signals with a proper analysis.
Bear in mind that backtesting performance doesn't guarantee future profitability. • Most systematic strategies are not suitable for each timeframe - if you use the different timeframe than the one it was tested on, the result can differ significantly. • You should perform your own backtest to base your trades on more data & to establish confidence in the selected strategy. • This script is not a replacement for proper analysis.
New strategies will be added when I have time. If I see multiple people asking for the same feature, I might agree to release it with a new version. I am not going to add input options in this script, it could come as a separate script though. I am in no way affiliated with the Youtube channel, so if you find the script helpful, shot me a message or send me some TradingView coins >)
If you encounter any bug, you can report it in a message or in comments. Support it with screenshot and relevant information such as a time when it occurred and what options were on etc.
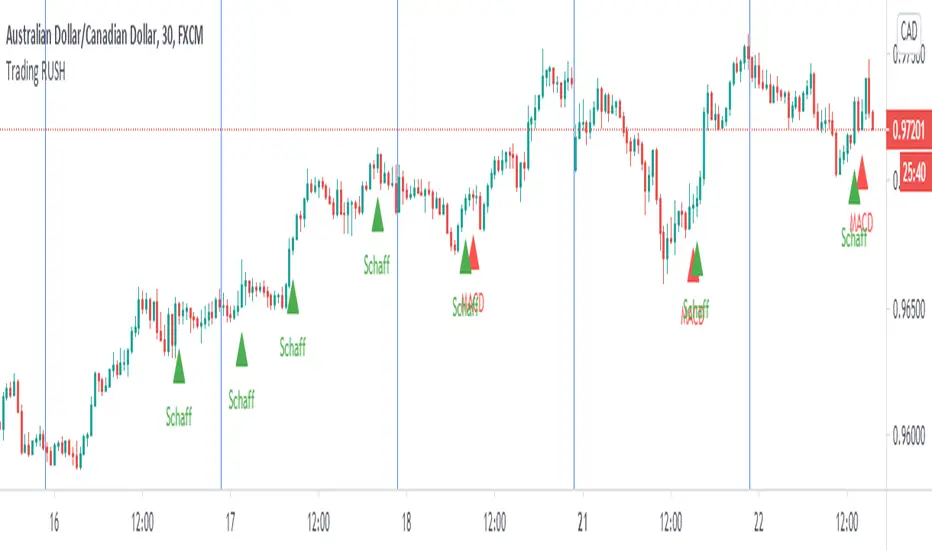
Trading Rush Signals & AlertsThis is an unofficial script for strategies tested on TRADING RUSH Youtube channel. Over time, most successful strategies will be added with an option to set strategy-specific alerts . Trading Rush Signals & Alerts will draw signals on the chart when the entry conditions are met. You can also opt for displaying indicators .
My script is meant for beginners but can be used by veterans too. Just pick only one or two strategies, you don't want to flood your chart with conflicting signals. You may want to support your trades with a proper analysis. If a new signal occurs when there is still an open position, you are not supposed to take another.
The current version includes MACD and Donchian Channels.
MACD strategy:
►Buy, when MACD crosses below the signal line when it is negative. The price must also be above 200 EMA.
►Sell, when MACD crosses above the signal line when it is positive. The price must also be below 200 EMA.
►This strategy was tested on 30-minute charts of EURUSD and EURJPY with reward-to-risk ratio 1,5 and win rate of 62% over 100 trades .
►►►MACD has to be added to your chart separately because it needs a new window. Indicators displaying will not add this indicator to the chart.
Donchian Channels strategy:
►Buy, when the price breaches Donchian to the upside after making a new low. The price must also be above 200 EMA.
►Sell, when the price breaches Donchian to the downside after making a new high. The price must also be below 200 EMA.
►Stop-loss is Donchian bottom for long and Donchian top for shorts. Check the channel for more information.
►This strategy was tested on 30-minute charts of EURUSD with reward-to-risk ratio 1,5 and win rate of 58% over 100 trades .
►►►I programmed alerts for Donchians to come ahead of an actual breach. If you often leave the screen when trading, this will help you. The necessary downside for that is the alerts might come when the signal doesn't trigger in the end. You will see a mark on the chart if the conditions are truly met.
Bear in mind that backtesting performance doesn't guarantee future profitability. • Most systematic strategies are not suitable for any timeframe. • You should perform your own backtest to base your trades on more data & to establish confidence in the selected strategy.
New strategies will be added when I have time. If I see multiple people asking for the same new feature, I might agree to release it with a new version. I am not going to add input options in this script, it could come as a separate script though. I am in no way affiliated with the Youtubechannel , so if you find the script helpful, shot me a message or send me some TradingView coins >)
If you encounter any bug, you can report it in a message or in comments. Support it with screenshot and relevant information such as a time when it occurred and what options were on etc.
PT Buy Sell IndicatorVersion 1.0 of our Buy & Sell indicator helps determine when a time-frame is ready for a possible reversal. The indicator is primarily based on the movement & behavior of the RSI. We recommend using the indicator on Binance exchange (USDT) with H1, H2, H3 & H4 time frames. We have put together a video with a strategy on how to take the signals best. Please watch the video to understand how to use it. You can also ask us questions in our discord to better understand the indicator.
There are currently two different settings that come with the indicator. Our aggressive & standard toggle each offer various set of signals.
- Aggressive toggle: more signals throughout multiple time-frames. Recommended for the more advanced traders that can combine technical analysis with their setups. Best time-frame H3, H4 & H12. (Use Reduce Signal Threshold input #7+)
- Standard toggle: fewer signals with a bit less risk. Recommended for traders that are just starting. Best time-frame 15m, 30m, H1, H2, 3D & 5D (Use Reduce Signal Threshold input #4)
The buys & sells are not in-sync with each other. They tend to fire independently when the specified time-frame is ready for a possible reversal.
The most successful method we structured for the buy/sell indicator is combining the PT STx & the PT Top/Bottom Bands (both included in our library). The PT Top/Bottom Bands helps you gauge the closest trouble area. When signals fire, we look at our top/bottom band indicator to find an entry as close to support/resistance as possible. The bands are isolated & color-coordinated.
Red Band - Overbought zone
Gray Bands - Within the range
Orange Band - Our EQ (middle of the range)
Green Band - Oversold zone
This eliminates the guessing game that invalidates your trade setup. The best risk to reward is taking sell signals (shorts) as close to the red band while targeting the orange band (eq) & taking buy signals as close to the green band while targeting the orange band (eq).
There are four different inputs that you can tweak to cater to your trading style. Each input is customizable based on the time frame. We get into detail about this in our video. Watch the video & do not take signals blind!
The secret sauce to having the highest success rate is to take the signals only when the PT STx (included in our library) has fired its algorithm.
This is an invite-only script. Please message us for access to our whole library.
As we keep making progress with our indicators, you will be granted access to each of them as long as you are a Pattern Trader member!
There will be limited access to our library until version 2.0 is released.

Keltner Channel AlertSimple Keltner Indicator with a custom alert.
The alert should ring when any Band has the price crossing.

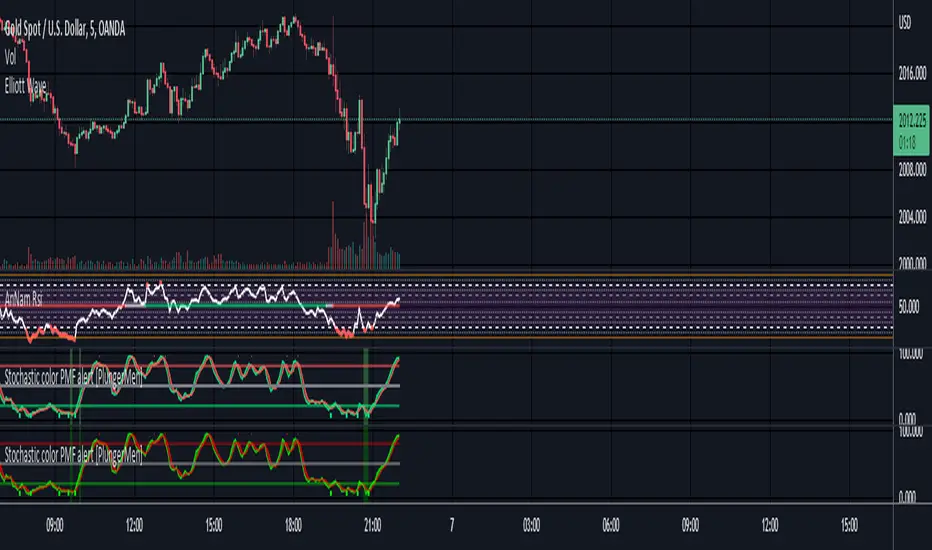
Stochastic color PMF alert [PlungerMen]The Stochastic Oscillator is a range bound momentum oscillator.
The Stochastic indicator is designed to display the location of the close compared to the high/low range over a user defined number of periods.
Typically, the Stochastic Oscillator is used for three things: Identifying overbought and oversold levels, spotting divergences and identifying bull and bear set ups or signals.
Retail Slayer StrategyRetail Slayer Strategy
Intended Markets: Forex, Indices, Cryptocurrencies, and metals (Gold, Silver)
Timeframe Use: 15 minutes only
Trailing Stop: 35-pips for Forex
The purpose of this strategy is to answer the question many retail traders have: Why does it feel like trades go against me immediately after placing a buy/sell? This strategy puts you into the position of taking trades against the majority of retail traders.
The underlying logic of this strategy involves the use of specific momentum, volatility, intra-week, and intra-day data to determine whether certain extremes that exist in common retail oscillators are truly indicative of a corrective move or a trend reversal. This strategy checks against those conditions to monitor whether certain breaks of certain price ranges are truly honest, or just fake-outs.
The 35-pip trail is intended for all of the Intended Markets listed above (ticks/points where necessary), and the 15-minute chart is also intended for all of the above-Intended Markets. There are options for you to adjust the trailing-stop, profit target, and stop(s) to fine-tune an instrument to your desired settings. However, I would recommend you stick with the 15-min, 35-pip default settings until you are more familiar with how this strategy works.
To utilize this strategy as an alert, simply add it to your chart then click on the Strategy Tester below. You will see a small alarm clock icon next to the cog-wheel - click the Alarm Icon and you can create the alert utilizing this strategy.
You will receive a notification warning you that this strategy can cause issues with repainting, and that is a known issue. However, with any strategy, it pays to confirm and do your own due diligence before committing to any trade. This strategy is intended to help identify and confirm entries in conjunction with your own analysis.
To inquire about access, please send me a PM. Please reach out if you have any questions.

Momentum Acceleration by DGTItalian physicist Galileo Galilei is usually credited with being the first to measure speed by considering the distance covered and the time it takes. Galileo defined speed as the distance covered during a period of time. In equation form, that is v = Δd / Δt where v is speed, Δd is change in distance, and Δt is change in time. The Greek symbol for delta, a triangle (Δ), means change.
Is the speed getting faster or slower?
Acceleration will be the answer, acceleration is defined as the rate of change of speed over a set period of time, meaning something is getting faster or slower. Mathematically expressed, acceleration denoted as a is a = Δv / Δt , where Δv is the change in speed and Δt is the change in time.
How to apply in trading
Lets think about Momentum, Rate of Return, Rate of Change all are calculated in almost same approach with Speed
Momentum measures change in price over a specified time period,
Rate of Change measures percent change in price over a specified time period,
Rate of Return measures the net gain or loss over a specified time period,
And Speed measures change in distance over a specified time period
So we may state that measuring the change in distance is also measuring the change in price over a specified time period which is length, hence
speed can be calculated as (source – source )/length and acceleration becomes (speed – speed )/length
In this study acceleration is used as signal line and result plotted as arrows demonstrating bull or bear direction where direction changes can be considered as trading setups
Just a little fun, since we deal with speed the short name of the study is named after famous cartoon character Speedy Gonzales
Trading success is all about following your trading strategy and the indicators should fit within your trading strategy, and not to be traded upon solely
Disclaimer: The script is for informational and educational purposes only. Use of the script does not constitutes professional and/or financial advice. You alone the sole responsibility of evaluating the script output and risks associated with the use of the script. In exchange for using the script, you agree not to hold dgtrd TradingView user liable for any possible claim for damages arising from any decision you make based on use of the script

Simple Study for Sean (threshold-triggered alert)This script illustrates how to create simple alerts, triggered by a share price moving above (or below) an arbitrary threshold.

Elliott Wave Oscillator Signals by DGTElliott Wave Principle , developed by Ralph Nelson Elliott, proposes that the seemingly chaotic behaviour of the different financial markets isn’t actually chaotic. In fact the markets moves in predictable, repetitive cycles or waves and can be measured and forecast using Fibonacci numbers. These waves are a result of influence on investors from outside sources primarily the current psychology of the masses at that given time. Elliott wave predicts that the prices of the a traded currency pair will evolve in waves: five impulsive waves and three corrective waves. Impulsive waves give the main direction of the market expansion and the corrective waves are in the opposite direction (corrective wave occurrences and combination corrective wave occurrences are much higher comparing to impulsive waves)
The Elliott Wave Oscillator (EWO) helps identifying where you are in the 5-3 Elliott Waves, mainly the highest/lowest values of the oscillator might indicate a potential bullish/bearish Wave 3. Mathematically expressed, EWO is the difference between a 5-period and 35-period moving average based on the close. In this study instead 35-period, Fibonacci number 34 is implemented for the slow moving average and formula becomes ewo = ema(source, 5) - ema(source, 34)
The application of the Elliott Wave theory in real time trading gets difficult because the charts look messy. This study (EWO-S) simplifies the visualization of EWO and plots labels on probable reversals/corrections. The good part is that all plotting’s are performed on the top of the price chart including a histogram (optional and supported on higher timeframes). Additionally optional Keltner Channels Cloud added to help confirming the price actions.
What to look for:
Plotted labels can be used to follow the Elliott Wave occurrences and most importantly they can be considered as signals for possible trade setup opportunities. Elliott Wave Rules and Fibonacci Retracement/Extensions are suggested to confirm the patters provided by the EWO-S
Trading success is all about following your trading strategy and the indicators should fit within your trading strategy, and not to be traded upon solely
Disclaimer : The script is for informational and educational purposes only. Use of the script does not constitutes professional and/or financial advice. You alone the sole responsibility of evaluating the script output and risks associated with the use of the script. In exchange for using the script, you agree not to hold dgtrd TradingView user liable for any possible claim for damages arising from any decision you make based on use of the script

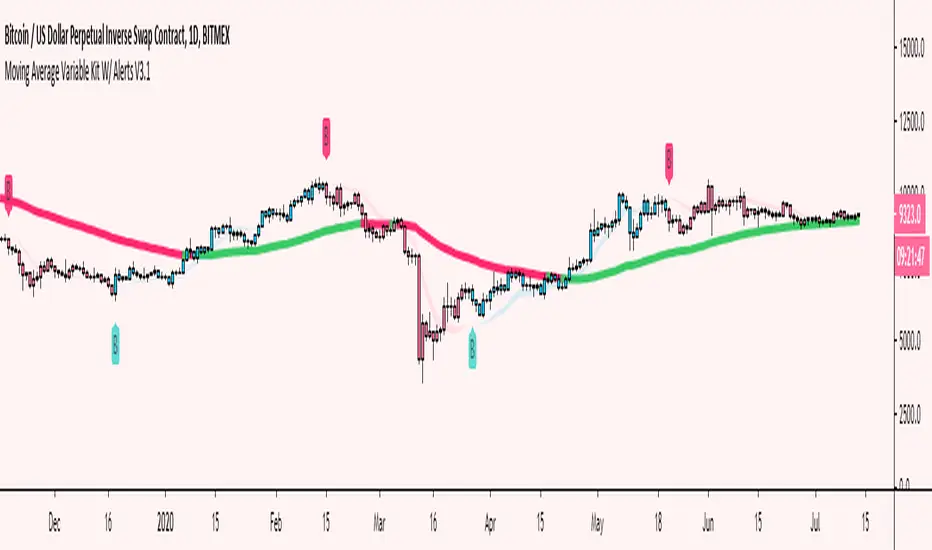
Moving Average Variable Kit W/ Alerts V3 [Moon]Create your own MA system
5 basic kinds of Moving Average types available for now
DEMA
EMA
SMA
TEMA
WMA
Mix and match moving average types and lengths.
Create your own alerts built into Tradingview.
Turn alerts or MAs off or on with 1 click.
Choose visual transparency and alert coloration - everything is customizable.
Trend candles on crossovers.
Choose your MA input source.
Create your own MA cloud or cloud ribbons.
Trend MA coloration on candle or bar interactions.
It really empowers you to experiment and create your own trading system or strategy.
Don't be afraid to use Renko or Heikin Ashi for trend spotting or reversals.
Copy built in exchange bands or indicators for an edge up on the competition or exchange users (these are heavily watched and in my opinion do affect the price action especially on smaller coins like alts).
This is Binance's default kit that you can easily make (7/25/99) SMAs.
Works well on traditional markets or Forex | Should be cross compatible on any asset or timeframe.
Turn off a majority of signals except for "buy" or "sell" alerts. Use these clusters to DCA, short, long or take profit.
Use it to monitor classic "Golden" or "Death" crosses - Set a TV alert to get a notification when it official goes off.
These are just a few of the things you can create. I encourage you to explore further.
Send me a DM if interested.