Scalping Trading System ALERT Crypto and StocksThis is the alert version of the strategy with the same name.
Indicators
SImple Moving Average
Exponential Moving Average
Keltner Channels
MACD Histogram
Stochastics
Rules for entry
long= Close of the candle bigger than both moving averages and close of the candle is between the top and bot levels from Keltner . At the same time the macd histogram is negative and stochastic is below 50.
short= Close of the candle smaller than both moving averages and close of the candle is between the top and bot levels from Keltner . At the same time the macd histogram is positive and stochastic is above 50.
Rules for exit
We exit when we meet an opposite reverse order.
This strategy has no risk management inside, so use it with caution !
Alert

BollingerBands Strat + pending order alerts via TradingConnectorSoftware part of algotrading is simpler than you think. TradingView is a great place to do this actually. To present it, I'm publishing each of the default strategies you can find in Pinescript editor's "built-in" list with slight modification - I'm only adding 2 lines of code, which will trigger alerts, ready to be forwarded to your broker via TradingConnector and instantly executed there. Alerts added in this script: 14, 17, 20 and 23.
SCRIPT INCLUDES PENDING ORDERS AND ALERTS! Alert will be sent to MetaTrader when order is triggered, but not yet filled. That means if market conditions change and order does not get filled, it needs to be cancelled as well, and there are alerts for that in the script as well.
How it works:
1. TradingView alert fires.
2. TradingConnector catches it and forwards to MetaTrader4/5 you got from your broker.
3. Trade gets executed inside MetaTrader within 1 second of fired alert.
When configuring alert, make sure to select "alert() function calls only" in CreateAlert popup. One alert per ticker is required.
Adding stop-loss, take-profit, trailing-stop, break-even or executing pending orders is also possible. These topics have been covered in other example posts.
This routing works for Forex, indices, stocks, crypto - anything your broker offers via their MetaTrader4 or 5.
Disclaimer: This concept is presented for educational purposes only. Profitable results of trading this strategy are not guaranteed even if the backtest suggests so. By no means this post can be considered a trading advice. You trade at your own risk.
If you are thinking to execute this particular strategy, make sure to find the instrument, settings and timeframe which you like most. You can do this by your own research only.

Profit Percentage TrackerThis script provides a quick and easy way to visualize profits in a chart, based on the given entry date and price.
Optionally, alerts can be sent when profits cross up the given " profit unit ".
In short:
Tracks how much profit one could take based on the input " entry date " and the input " entry price "
These inputs are interactive (www.tradingview.com)
Displays the result in a label on top of the last candle
(Optional) Sends alerts based on the given " profit unit ", that is: if ' 0.5 ' is given, then an alert is triggered every time the profit is raised by that number
(Be careful with low values, as TradingView could stop an alert if it triggers too much.)
For alerts to be displayed, a " script alert " must be created right after the script was added to the chart:
- www.tradingview.com
(Choose ' Profits ' as condition and ' Any alert() function call ')
Good to know: if you check " Notify on app ", alerts can be delivered directly to your phone:
i.imgur.com
Prerequirements :
The chart's timezone has to be set to " Exchange " (this is required in order to support the alert's logic):
- kodify.net

TWP Next Bar Close Countdown█ OVERVIEW
This script displays the time remaining for your charts current timeframe.period or a higher timeframe with the ability to create alerts that ping on the opening of the new bar that you have selected. It can be very easy to get bogged down in the charts when day trading on smaller timeframes and forgetting that it is the wave of longer timeframe traders that are setting the tone. This script was born out of this pitfall that I was noticing in my own trading.
█ CONCEPTS
The script uses a series of functions to get produce the time remaining and texts for the top and bottom rows within the table display.
█ FEATURES
1 — Resolution
• Auto / Manual selection
• There is tooltip explains how the automatic time selection operates (see below)
AUTO_TIMEFRAME_TOOLTIP = "When the Auto option is selected, the timeframe of the indicator is chosen automatically based on the chart timeframe. The Timeframe dropdown is ignored. The automated timeframes are:
'10 minutes' for any chart timeframes below '1 minute'
'1 hour' for any chart timeframes starting from '1 minute' up to '5 minutes'
'4 hours' for any chart timeframes starting from '5 minutes' up to '60 minutes'
'1 day' for any chart timeframes starting from '1 hour' up to '4 hours'
'1 week' for any chart timeframes starting from '4 hours' up to '1 day'
'1 month' for any timeframes starting from '1 day' up to '1 week'
'3 months' for any timeframes starting from '1 week' up to '1 month'
'12 months' for any timeframes above '1 month'"
2 — Text
• Size selection
• Color selection
3 — Display
• Frame color selection
• Display position selection
4 — Alerts
• Market session selection
█ HOW TO USE
• Add it to your chart, select your timeframe, change up your colors, and enjoy yourself
█ NOTES
• We have no control over when realtime updates occur. A realtime bar can open, and then no realtime updates can occur until the open of the next realtime bar. The time between updates can vary considerably. For more please check out Pine's execution model and bar states.
• As a reminder, I did make this script for myself so if you find that you are using a 2-hour alert or countdown the formatting for the words may not be succinct as they should be. We will write that loss off to my growing pine skills
█ LIMITATIONS
• You will not be able to retrieve the time from a timeframe smaller than what is currently selected for the chart.

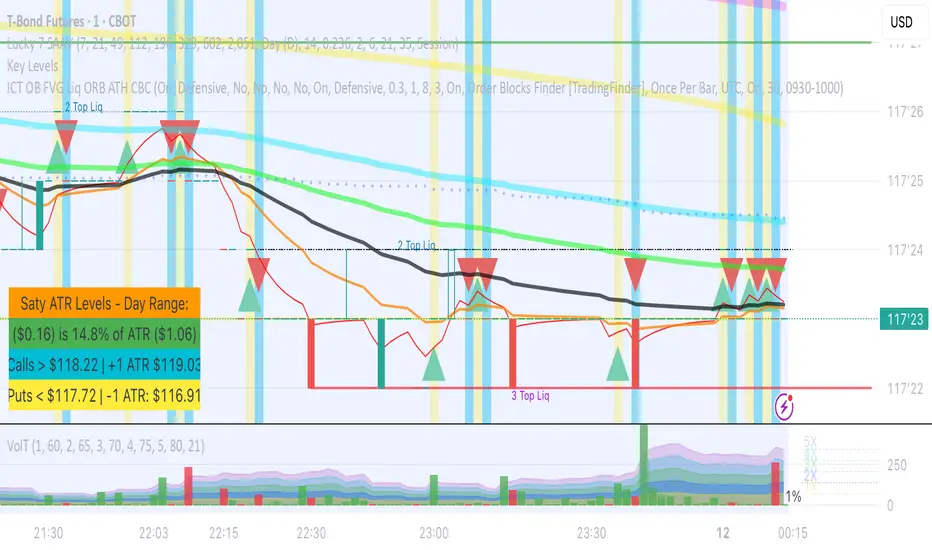
VolT by empowerTVolT is conceived to expose and alert volume volatility.
Using 21-candle moving average volume values compared to the current candle volume, you can graphically see the volume as it comes in - as a percentage of the historic 1X volume moving average.
Getting close to 2X or 5X of the 21-candle SMA? Just glance at the transparent plots behind the volume bars - or the actual percentage value in yellow.
Never wonder again how much volume that bar is compared to previous volume - now you know. Set alerts based on the volume crossing your chosen volume SMA. You'll never be surprised that the hedgies loaded up and left you behind, because you'll be right there loading up with them. (Let me know if you need help setting the alerts...)
As always, your feedback and criticisms are appreciated.
Pivot Points on SR lines DEMOAnalyzing price movements for a few years taught me one thing - markets always reverse bouncing off some horizontal Support/Resistance level. The only exception to this rule is when market pops new ATH (All Time High), which certainly happened in so-called "price discovery" run - this asset has never been in this space before, so no Support/Resistance could have been formed, while the rally had to stop at some point anyway.
In all other cases, analyzing past market movements, you will be able to find a place where the market reversed or gathered before. The difficulty is to understand (or guess?) from which S/R level market will reverse right now, because there are many of them. Even if this is probably not possible to make such guess correctly and always, it is good to know when potential reversal shown by whatever indicator you're using happened on SR line or in the middle of nowhere. That last case would turn out to be fake to your worst regrets. Ability to filter-out all those fake pivots is a value my indicator delivers.
Example? It is very often considered an entry signal when Stochastic %K and %D lines cross each other, especially in overbought/oversold area. It could work quite well in sideways markets, but when a trend begins, Stochastic would report CONSECUTIVE counter-trend signals, draining your trading balance to zero quickly. But this trend took place in price-discovery area (not necessarily when going for the new ATH ), so all those counter-trend signals happened not at S/R levels. Hence, they should be ignored.
Big triangles mark pivot point which happened on the S/R line. Small triangles - in the middle of nowhere.
How good is it? I compared it with one of my previous scripts, the "PivotPoints with Momentum confirmation" (), this new script confirms only 1/3 of pivots in the old script on 1m EURUSD chart. Filtering out 2/3 of potentially bad entries is a good result, I'd say :)
This script also fires alerts - alert is triggered as soon as PivotPoint is noticed, on a candle close.
I strongly recommend NOT using it not using this indicator as a standalone indicator. There is so much information you should take into consideration as well - market bias, volume , higher timeframe trend... To make it convenient to join PivotPoints information with other indicators, I have "exported" one plot so you can include it in your own - just use input.source in your own code to have it return 1 for PivotLow ( aka Long entry) and -1 for PivotHigh ( aka Short entry).

Consecutive Up/Down Strat + alerts via TradingConnector to ForexSoftware part of algotrading is simpler than you think. TradingView is a great place to do this actually. To present it, I'm publishing each of the default strategies you can find in Pinescript editor's "built-in" list with slight modification - I'm only adding 2 lines of code, which will trigger alerts, ready to be forwarded to your broker via TradingConnector and instantly executed there. Alerts added in this script: 12 and 15.
How it works:
1. TradingView alert fires.
2. TradingConnector catches it and forwards to MetaTrader4/5 you got from your broker.
3. Trade gets executed inside MetaTrader within 1 second of fired alert.
When configuring alert, make sure to select "alert() function calls only" in CreateAlert popup. One alert per ticker is required.
Adding stop-loss, take-profit, trailing-stop, break-even or executing pending orders is also possible. These topics have been covered in other example posts.
This routing works for Forex, indices, stocks, crypto - anything your broker offers via their MetaTrader4 or 5.
Disclaimer: This concept is presented for educational purposes only. Profitable results of trading this strategy are not guaranteed even if the backtest suggests so. By no means this post can be considered a trading advice. You trade at your own risk.
If you are thinking to execute this particular strategy, make sure to find the instrument, settings and timeframe which you like most. You can do this by your own research only.

RSI Strategy with alerts via TradingConnector to ForexSoftware part of algotrading is simpler than you think. TradingView is a great place to do this actually. To present it, I'm publishing each of the default strategies you can find in Pinescript editor's "built-in" list with slight modification - I'm only adding 2 lines of code, which will trigger alerts, ready to be forwarded to your broker via TradingConnector and instantly executed there. Alerts added in this script: 12 and 17.
How it works:
1. TradingView alert fires.
2. TradingConnector catches it and forwards to MetaTrader4/5 you got from your broker.
3. Trade gets executed inside MetaTrader within 1 second of fired alert.
When configuring alert, make sure to select "alert() function calls only" in CreateAlert popup. One alert per ticker is required.
Adding stop-loss, take-profit, trailing-stop, break-even or executing pending orders is also possible. These topics have been covered in other example posts.
This routing works for Forex, indices, stocks, crypto - anything your broker offers via their MetaTrader4 or 5.
Disclaimer: This concept is presented for educational purposes only. Profitable results of trading this strategy are not guaranteed even if the backtest suggests so. By no means this post can be considered a trading advice. You trade at your own risk.
If you are thinking to execute this particular strategy, make sure to find the instrument, settings and timeframe which you like most. You can do this by your own research only.

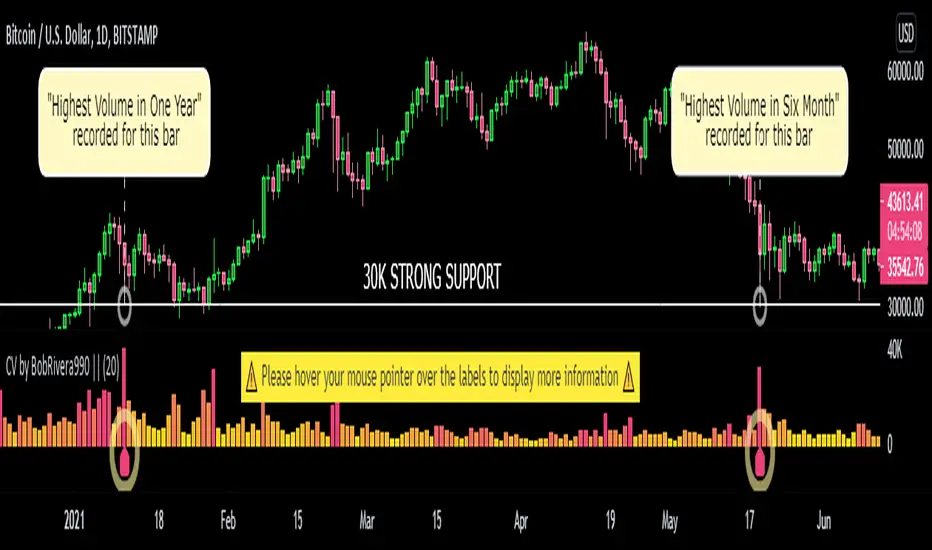
Custom Volume - Periodic Peaks & Troughs + AlertThis script is a custom volume indicator with additional features.
But why is this useful?
The minimum and maximum volumes, in different time periods, are displayed by labels below the bars. I call them "Peaks" and "Troughs".
Hover your mouse cursor over the labels to see more details.
These parameters are widely used in technical analysis.
If traders want to confirm a reversal on a level of support–or floor–they look for high buying volume. Conversely, if traders are looking to confirm a break in the level of support, they look for low volume from buyers.
If traders want to confirm a reversal on a level of resistance–or ceiling– they look for high selling volume. Conversely, if traders are looking to confirm a break in the level of resistance, they look for high volume from buyers.
For example, take a look at the chart.
Settings menu parameters
{Dialog Box} =>
Parameter to show / hide the dialog box.
{Visual Parameters} =>
Parameters to personalize the appearance of the indicator.
{ Alert Conditions Part 01: Peaks ⏰ "} =>
Parameters to customize the alert.
{ Alert Conditions Part 02: Troughs ⏰ "} =>
Parameters to customize the alert.
{Volume MA} =>
Moving average settings
How to use alerts
Note that by creating an alert, an instance of the indicator, with all your settings, will be activated on the site's server and alerts will be triggered by it.
After that, changing the indicator settings on the chart will no longer affect the alert.
Open the settings window and select the alert conditions as you wish
Click the Create Alert button (or press the A key while holding down the ALT key)
In the Condition section, select the name of the indicator.
Make the rest of the settings as you wish.
Finally, click on the Create button.
It's finished. After a few moments, your alert will be added to the Alerts menu.
Limits
The labels are displayed after the bars close.
Labels are displayed for the last 10,000 bars.
References: Investopedia
Moving Stop-Loss mechanism + alerts to MT4/MT5"How to code moving stop-loss mechanism", is one of the most often repeating questions in private messages I receive, so just to focus on this mechanism, I made a spin-off from my previous script: TradingView-Alerts-to-MT4-MT5-dynamic-variables-NON-REPAINTING .
The logic here moves the stop-loss each time a trade is running and a new pivot high/low is detected. When such event occurs (UpdateLongStopLoss or UpdateShortStopLoss), stoploss_long or stoploss_short mutable variable is modified. And it needs to be coded inside strategy.exit() line as "stop=stoploss_long" or "stop=stoploss_short". Entries are pretty straightforward - on Stoch crosses.
Last lines of the script show how to wrap information about such updates and send send alerts to MetaTrader via TradingConnector for execution in Forex/indices/commodities/crypto markets via MetaTrader. Please note that "tradeid=" variable must be passed with each alert, to let MetaTrader know which trade to modify. SLMOD, TPMOD are recently added commands, along with BE (as in "move stop-loss to breakeven" - but that's another topic).
Please disregard strategy backtest results, as this script is for coding education purposes only. However, it seems with the stop-loss mechanism enabled, the results are even better, than in original version of the script :)

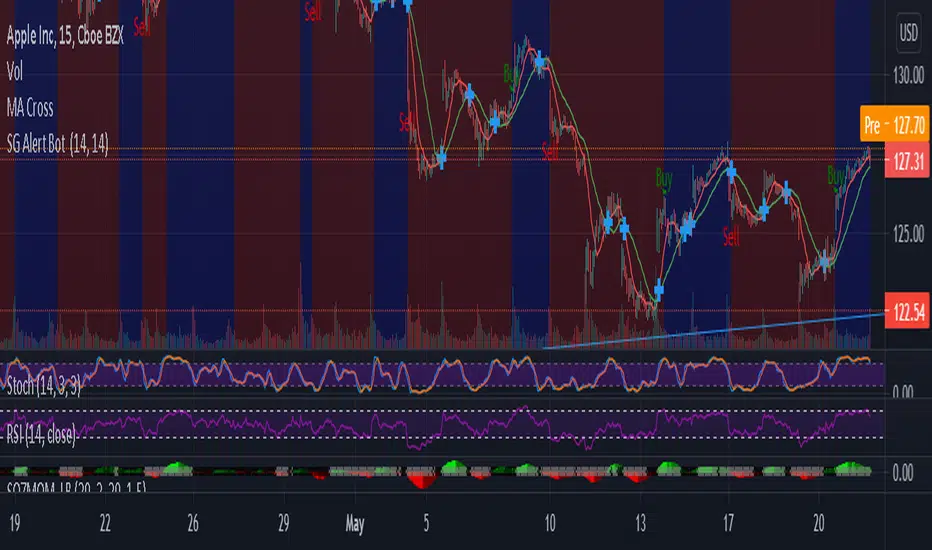
Smart AlertsThis indicator provides back-tested signals and alerts from multiple technical indicators.
No more guessing whether or not you should trust an indicator. See your indicators' past performance at a glance.
No more false alarms. Disable re-painting of signals.
When multiple indicators overlap, a Confluence indicator will print (large triangle). With your settings properly tuned, this will show a HIGH probability of a move.
Current Signal/Alert Options (more to come):
RSI Oversold
RSI Overbought
EMA Crossing Up
EMA Crossing Down
Buy Signal Confluence
Sell Signal Confluence
Instructions:
-Enable/disable individual indicators so you can fine tune one at a time
-Adjust the indicator's settings
-Adjust your trade parameters (Max Wait, Take Profit %). Signals that would have given the desired profit in the time allowed will be painted orange.
-Repeat this process with each indicator until you're satisfied
-Set-up alerts

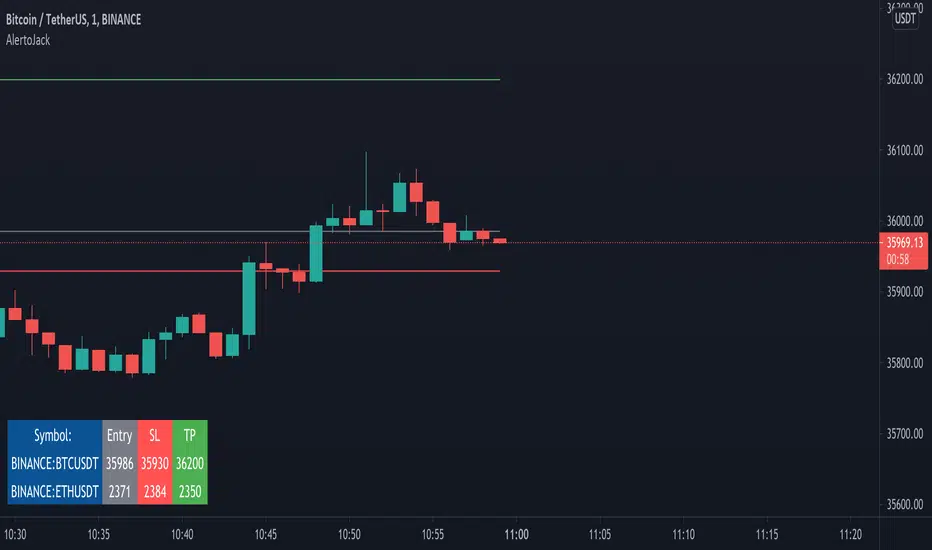
AlertoJack AlertoJack
v0.1a
coded by Bogdan Vaida
This indicator was created to provide easily defined alerts on multiple symbols.
It's still POC code.
Usage:
- Add it on any coin,
- The chart timeframe will be the timeframe for the alerts;
- Configure it with the symbols you want to be alerted on,
- Add the prices to be alerted for,
- Use Add Alert -> condition AlertoJack -> "Any alert() function call"
- Check the Alerts log.
Notes:
- Alert happens when candle crosses the price.
- Because of how Trading View functions, if you modify the indicator settings
you'll need to add the alerts again (because an alert uses the code version
it was created from).
- The alert runs once per current bar's timeframe (e.g. once per minute
if you're on the 1m).
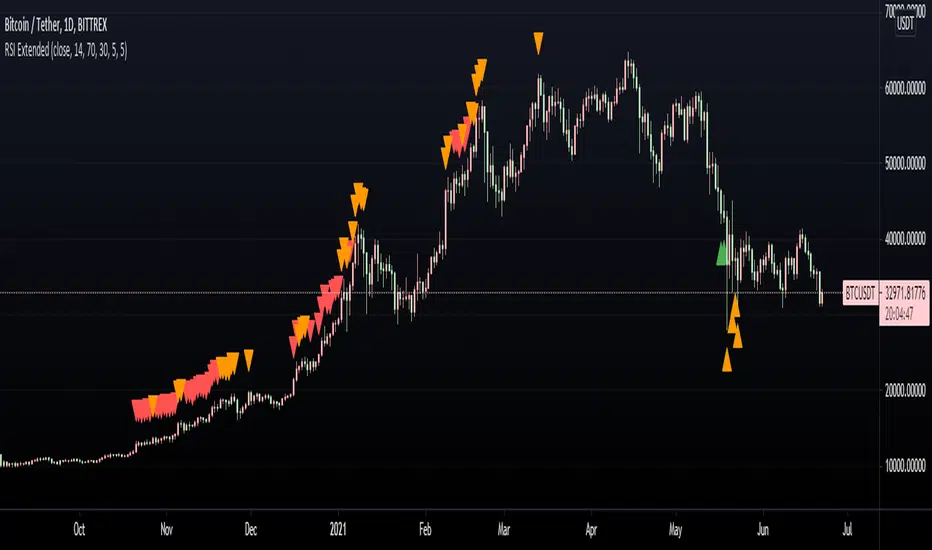
RSI ExtendedThis script is intended to print signals on the main price chart and send alerts when the RSI is overbought or oversold.
You can customize the source of the signal (open, close, etc), as well as oversold/overbought levels, and RSI length.
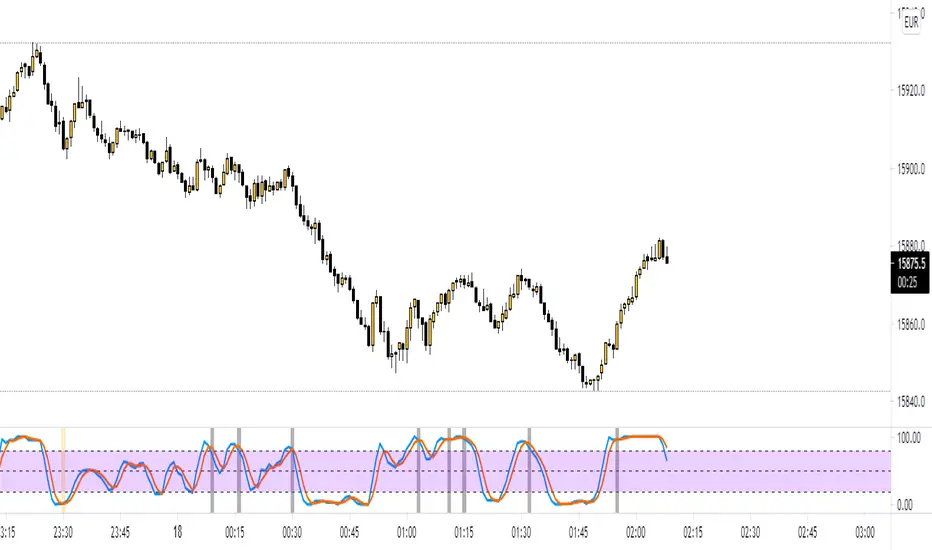
Stochastic RSI w/ Crossover Alerts (by WJ)NOTE:
// STOCH RSI CODE TAKEN FROM DEFAULT INDICATOR
// I HAVE ONLY MADE SOME ADJUSTMENTS FOR VISUAL AID
// I MADE THIS FOR MY OWN USE BUT HAVE DECIDED TO PUBLISH AND SHARE IN CASE ANYBODY WANTS TO USE IT
This is the normal default built-in Stochastic RSI indicator which I have added some stuff for visual aid:
Added middle line (50)
Stoch RSI background turns green when K line crosses D line UPWARDS, K line is below the 50 level, and price is above 200 EMA
Stoch RSI background turns red when K line crosses D line DOWNWARDS, K line is above the 50 level, and price is below 200 EMA
Alert notification on the crossover candle with background colour change conditions met
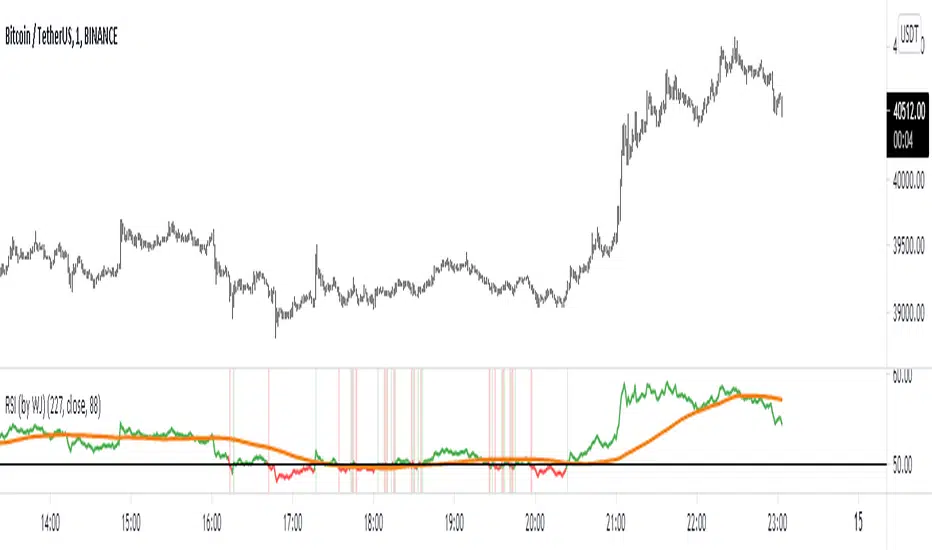
Relative Strength Index w/ 3 Levels & 0 Line Colour (by WJ)NOTE:
// RSI CODE TAKEN FROM DEFAULT INDICATOR
// I HAVE ONLY MADE SOME ADJUSTMENTS FOR VISUAL AID
// I MADE THIS FOR MY OWN USE BUT HAVE DECIDED TO PUBLISH AND SHARE IN CASE ANYBODY WANTS TO USE IT
This is the normal default built-in RSI indicator which I have added some stuff for visual aid:
Added middle line (50)
RSI turns green when crossed above 50
RSI turns red when crossed below 50
RSI background turns green and red on crossover candle based on whether RSI just crossed over or below 50 respectively
Alert notification on the crossover candle
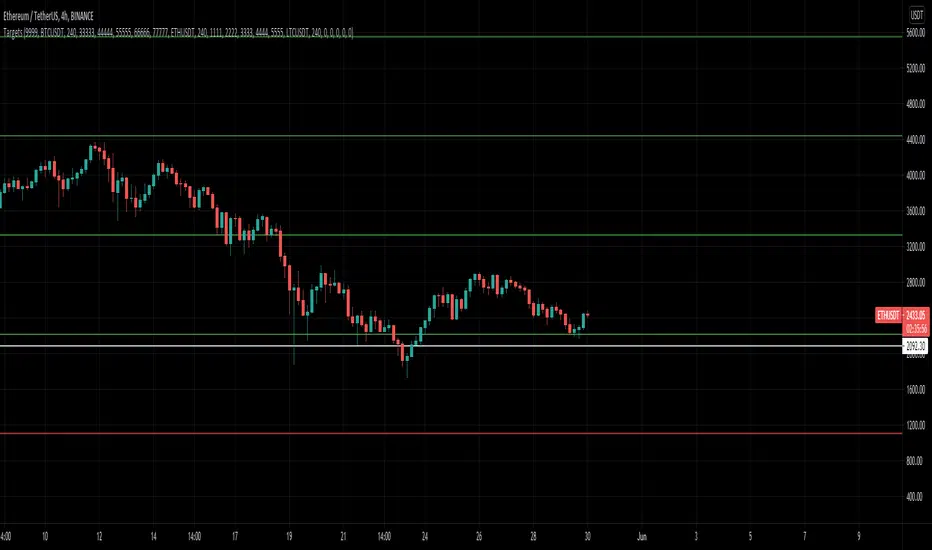
MultiAlert LITEAllows one to set 5 price level alerts on one symbol (1 Stop Loss 4 Targets)
Alerts work by prices crosses under the stop loss or over the targets, enabling short reverses this.
Unlike regular MultiAlert, this actually draws a true horizontal price at your price.
This is a lighter version of MultiAlert, supporting only one symbol. Your price levels will appear on all charts unless you hide the indicator.
Make the alert with targets and stop loss set, every time you make a change you MUST REMAKE THE ALERT.
Please comment any problems .

MultiPrice AlertThis is an alert script using Pinescript version 4. This enables one to set 5 alerts (1 StopLoss, 4 Targets), on 3 different symbols, at using a single alert in the UI.
Every visible line will only appear on the symbols that are selected. After setting targets when making an alert, select this indicator as a condition. Change the name to whatever you want, usually the names of the set of tickers.
The Alert message is dyanmic showing which Symbol with each type of alert, at whatever price.
Ability to disable the targets + symbols.
Alerts work by Stop Loss crossing under price and Targets Cross Over. Enabling the "Short" Targets reverses this.
The line that is being displayed is actually the price of the asset being moved over x number of bars. I have not found a way to plot a traditional horizontal line, as the code for it uses a fixed price.
As it being a user input, it is a variable. Any help with this would be appreicated.
Alerts are set to once per bar.
Known bug that sometimes if the prices that you set are inside the current candle stick, then your alert will immeaditally fire, either change the timeframe or let it fire and wait fo
After a target is hit, I reccomend setting the alert to 0 and REMAKING the alert. You MUST REMAKE THE ALERT AFTER ANY CHANGES. This script WILL NOT CHANGE ALERTS AS YOU CHANGE SETTINGS.
TradingView Alerts are not this smart , at least I haven't found a way to do this yet.

MultiAlert, MultiTargets + TickersThis is my first script, completely made from scratch. Bear with me.
Script that allows one to set an alert for Multiple Price Levels, on Multiple Tickers, complete with Dynamic Messages showing you which ticker, at which price, at which alert (Stop loss, Target 1 etc.), set to Once Per Bar.
Select Ticker, type in price levels that you have for targets & stop loss, move on to the next, or don't and leave 0 and blank.
Disable the targets you do not need in STYLE tab to disable plotting & scaling, leave unused tickers & targets blank & 0.
Create Alert, select this indicator, anyfunction() alert.
MAKE SURE to remake the alert every time you change something, they are not smart enough to change as you change things. Can Confirm by using the numbers in the alert name. You will also have to set the profit level or stop loss to zero every time it triggers to avoid triggered again.
In fact, you do not need the indicator active at all. Add it to a chart and hide it by clicking on the little eyeball icon, to make an alert open the settings for the indicator and type in your targets like normal. Indicator will remain invisable.
I have not found a way to dynamic message the alert name, or else I would.
DISCLAIMER: NONE OF THIS IS FINANCIAL ADVICE. You are completely responsible for whatever happens to you. Do not use the targets in this chart. Do your own research before trading.
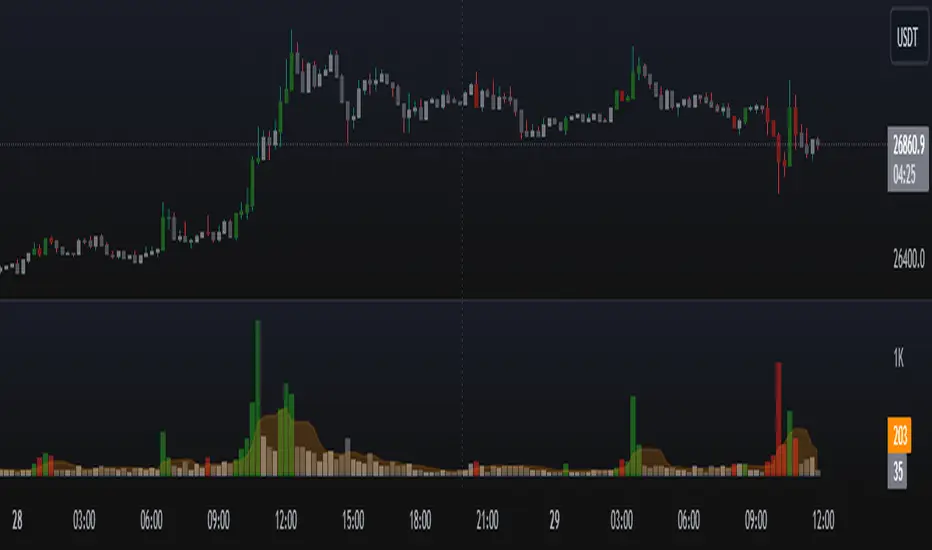
PVA Volume - DataCrypto Analytics
The PVA Volume indicator (Price Volume Analysis) is a technical indicator that transforms the accumulated historical data.
The PVA Volume Indicator displays a color-coded volume histogram based on Price Volume Analysis (PVA). It is plotted on a separate panel below the price chart of the underlying asset and colors the candles according to the PVA. The indicator represents four market states by means of four different colored histogram bars:
Green : Extreme volume on a bullish candle
Red : Extreme volume on a bearish candle
Silver : Neutral Volume, increasing more than the average
Gray : Neutral Volume
The PVA Volume indicator can be applied to confirm the action of the high or low price of any financial instrument.
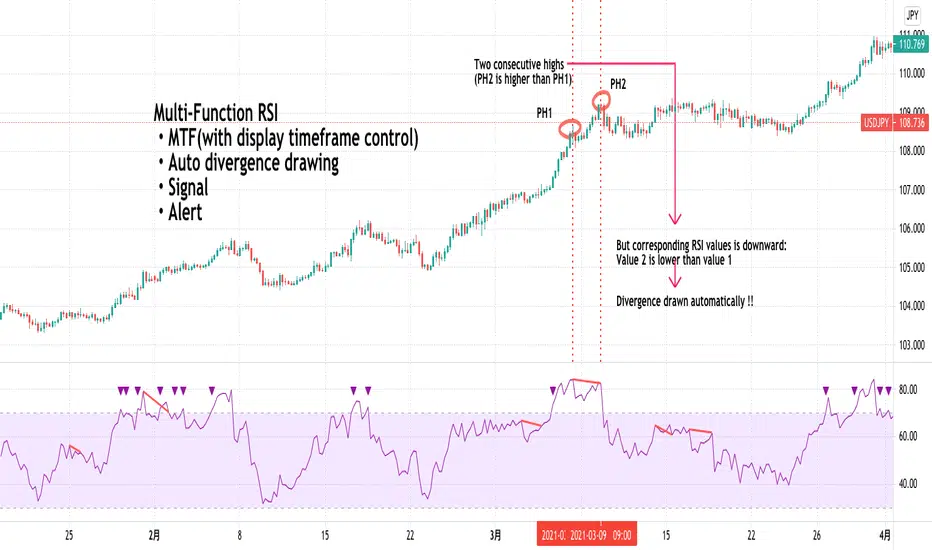
Multi-Function RSI(MTF, divergence, signal and alert)Japanese below / 日本語説明は下記
Overview
Multi-function RSI indicator with functions below.
1.MTF with display timeframe control
2.Auto divergence drawing incl. hidden divergence
3.Signal when RSI crosses over upper band/crosses under lower band
4.Color background when MTF RSI crosses over/under lower band
5.Alert when RSI crosses over upper band/crosses under lower bands
Please see the details below.
Functions:
1.MTF with display timeframe control
You can display daily, 4hour or 1 hour RSI or all of them as upper timeframe MTF RSI.
How is it different from other MTF indicators?
Problems with other MTF RSI indicators are;
-If you set higher timeframe RSI, it will also be shown on further higher timeframes.
i.e. If you set 4hour chart’s RSI on 1 hour or lower time frame charts, it will also appear on daily and weekly chart, which is not necessary.
To tackle these problems, this indicator has incorporated functions below.
-To show MTF RSI on timeframe lower than the upper timeframe you set as MTF timeframe.
For example, if you select daily timeframe for MTF RSI , the RSI will be shown only on 4 hour or lower timeframes(1H, 30M, 15M, 5M, 1M).
Left: 4hour chart, Middle: Daily chart, Right: Weekly chart
If you look at 4hour chart, daily chart’s RSI is shown(pale blue and orange) but weekly chart does not show daily chart’s RSI.
2.Auto divergence drawing incl. hidden divergence
Regular divergence line and hidden divergence line will be automatically drawn for current timeframe RSI as per the logic below.
Bearish : When two consecutive pivot highs go up but RSI values corresponding to each high go down.
Bullish: When two consecutive pivot lows go down but RSI values corresponding to each low go up.
Pivot highs(lows) are identified when those are preceded by n lower highs(lows) and proceeded by n lower highs(lows).
* n is parameterized.
See the diagram below.
Bearish : When two consecutive pivot highs go down but RSI values corresponding to each highs go up.
Bullish : When two consecutive pivot lows go up but RSI values corresponding to each low go down.
3.Signal when RSI crossing upper/lower bands
Signal will be shown when;
-RSI(current timeframe) crosses over upper band
-RSI(current timeframe) crosses under lower band
Example:
Purple triangle is signals.
4.Color background when MTF RSI crosses over/under lower band
Background color can be applied when MTF RSI crosses over upper band/under lower band.
Example:
Pale purple is daily RSI on 4 hour chart. Background color applied while daily RSI is outside upper/lower bands.
5.Alert when RSI crosses over upper band/under lower band
Alert can be set when;
-RSI crosses over upper band
-RSI crosses under lower band
How to use this indicator?
This indicator is paid indicator and invited-only indicator.
Please contact me via private chat or follow links in my signature so that I can grant the access right to the indicator.
Comment section is only for comments on the indicator or updates. Please refrain from contacting me using comments to follow TradingView house rules.
———————————————————————————————————————
多機能RSIインジケーターです。以下の機能が搭載されています。
1.マルチタイムフレーム機能(表示時間足制御機能付き)
2.ダイバージェンス自動描画機能(ヒドゥンダイバージェンス対応)
3.RSIがアッパーバンド、ロワーバンドとクロスした時にシグナル表示
4.上位足RSI(MTF RSI)がアッパーバンドより上にある時、ロワーバンドより下にある時に背景をハイライト
5.RSIがアッパーバンド、ロワーバンドとクロスした時にアラート設定
機能詳細は以下の通りです。
機能詳細
1.マルチタイムフレーム機能(表示時間足制御機能付き)
日足、4時間足、1時間足のいずれか、もしくは全てをRSIをマルチタイムフレームRSIとして表示することができます。(不要な場合は非表示可能)
他のマルチタイムフレームRSIとの違い
他のマルチタイムフレームRSIのインジケーターでは、以下の問題に直面します。
・上位足のRSIを表示すると、さらに上位足でもそのRSIが表示され見にくくなる。
例: 4時間足のRSIを下位足で表示可能な様に設定すると、日足や週足でも表示され、チャートが見にくくなる。
この問題に対して、このインジケーターでは、
・上位足のRSIを表示する時間軸を制御することで上位足で不必要な情報を表示させない。
という機能を加えることでこの問題を解決しています。
具体的には、マルチタイムフレーム用に選択した上位足のタイムフレームより小さいタイムフレームでのみ上位足のRSIが表示されるようになっています。
例えば、上位足として日足を選択した場合、日足のRSIは4時間足、1時間足、30分足、15分足、5分足、1分足にのみ表示されます。
<サンプルチャート>
左から4時間足、日足、週足です。
4時間足では日足のRSI(薄いパープルのライン)が表示されていますが、週足には表示されません。これはオシレーターが表示される時間軸を裏側のロジックで制御しているためです。
2.ダイバージェンス自動描画機能(ヒドゥンダイバージェンス対応)
以下のロジックに基づきダイバージェンスを自動描画します。(不要な場合は非表示可能)
<通常のダイバージェンス>
下降示唆:2つの連続する高値(*)が切り上げられているが、 それぞれの高値に対応するRSIの値は切り下げている場合
上昇示唆:2つの連続する安値(*)が切り下がっているが、 それぞれの安値に対応するRSIの値は切り上がっている場合
*高値(安値)は、左右n本(**)ずつのローソク足の高値(安値)より高い(低い)高値(安値)をピボットハイ・ローとして算出しています。
** nはユーザ設定値です。
<例: ダイバージェンス>
高値PH1はPH1のローソクの高値より左側にn個のより低い高値、右側にn個のより低い高値があった場合に高値として認識されます。
上記の例では高値がPH2>PH1と切り上がっていますが、対応するRSIの値はvalue2
下降継続示唆:2つの連続する高値(*)が切り下がっているが、 それぞれの高値に対応するRSIの値は切り上がっている場合
上昇継続示唆:2つの連続する安値(*)が切り上がっているが、 それぞれの安値に対応するRSIの値は切り下がっている場合
言うまでもないことですが、ダイバージェンスが出たから逆張り、などの安易な発想は避けるべきです。
環境認識の一つの要素として見るべき指標でしょう。
3.RSIがアッパーバンドを上抜いた時、ロワーバンドを下抜いた時にシグナル表示
アッパーバンド(初期値70)とロワーバンド(初期値30)の数値は変更可能です。
サンプルチャート:
4.上位足RSI(MTF RSI)がアッパーバンドより上にある時、ロワーバンドより下にある時に背景をハイライト
サンプルチャート:
日足のRSI(薄いパープルのライン)がアッパーラインより上にある時に背景がグレーがかっています。
このように上位足のRSIの状況を視覚的に認識したい時に役立つでしょう。
日足RSIラインは非表示にすることができますので、背景色だけ表示しておいて、背景に色が付き、かつダイバージェンスも出たら反転を警戒といった状況判断が可能です。
5.RSIがアッパーバンド、ロワーバンドとクロスした時にアラート設定
アラートを設定したいタイムフレームを開いた状態で、アラート設定の画面を開き以下の条件を選択することができます。
・RSIがアッパーバンドを上抜いた時
・RSIがロワーバンドを下抜いた時
インジケーターの使用について
当インジケーターは招待制インジケーター(有料)となっています。
使用を希望される方はプライベートチャットや下記リンクのDMでご連絡ください。
このページのコメント欄はインジケーターそのものに対するコメントやアップデートの記載のためのものとなっております。Tradingviewのハウスルールを守るためにもコメント欄からの連絡はご遠慮ください。
MACD oscillator with EMA alert version 4HThis is the study/indicator alert version of the macd + ema strategy.
The strategy details are the following :
Is a simple, yet efficient strategy, which is made from a combination of an oscillator and a moving average.
Its setup for 4h candles with the current settings, however it can be adapted to other different timeframes.
It works nicely ,beating the buy and hold for both BTC and ETH over the last 3 years.
As well with some optimizations and modifications it can be adapted to futures market, indexes(NASDAQ, NIFTY etc), forex( GBPUSD ), stocks and so on.
Components:
MACD
EMA
Time condition
Long/short option
For long/exit short we enter when we are above the ema , histogram is positive and current candle is higher than previous.
For short /exit long , when close below ema , histo negative and current candles smaller than previous
If you have any questions please let me know !

Multi-Function Stochastic(MTF, divergence, signal and alert)Japanese below / 日本語説明は下記
Overview
Multi-function Stochastic indicator with functions below.
1.MTF with display timeframe control
2.Auto divergence drawing incl. hidden divergence
3.Signal when % K crosses over %D incl. MTF %K and %D
4.Alert when % K crosses over %D
Please see the details below.
Functions:
1.MTF with display timeframe control
You can select one upper timeframe from monthly, weekly, daily, 4hour, 1hour, 30mins, 15mins, 5mins to display upper timeframe’s Stochastic as MTF Stochastic.
How is it different from other MTF indicators?
Problems with other MTF Stochastic indicators are;
-If you set higher timeframe Stochastic, it will also be shown on further higher time frames.
i.e. If you set 4hour chart’s Stochastic on 1 hour or lower time frame charts, it will also appear on daily and weekly chart, which is not necessary.
To tackle these problems, this indicator has incorporated functions below.
-To show MTF Stochastic on timeframe lower than the upper timeframe you set as MTF timeframe.
For example, if you select daily timeframe for MTF Stochastic , the Stochastic will be shown only on 4 hour or lower timeframes(1H, 30M, 15M, 5M, 1M).
Left: 4hour chart, Middle: Daily chart, Right: Weekly chart
If you look at 4hour chart, daily chart’s Stochastic is shown(pale blue and orange) but weekly chart does not show daily chart’s Stochastic.
2.Auto divergence drawing incl. hidden divergence
Divergence line and hidden divergence line will be automatically drawn for the current timeframe Stochastic as per the logic below.
Bearish : When two consecutive pivot highs go up but %K values corresponding to each high go down.
Bullish: When two consecutive pivot lows go down but %K values corresponding to each low go up.
Pivot highs(lows) are identified when those are preceded by n lower highs(lows) and proceeded by n lower highs(lows).
* n is parameterized.
See the diagram below.
Bearish : When two consecutive pivot highs go down but %K values corresponding to each highs go up.
Bullish : When two consecutive pivot lows go up but %K values corresponding to each low go down.
3.Signal when % K crossing %D
Signal will be shown when;
-%K crosses over %D below lower band
-%K crosses under %D above upper band
-%K(MTF) crosses over %D(MTF) below lower band
-%K(MTF) crosses under %D(MTF) above upper band
4.Alert when % K crossing %D
Alert can be set when;
-%K crosses over %D below lower band
-%K crosses under %D above upper band
How to use this indicator?
This indicator is paid indicator and invited-only indicator.
Please contact me via private chat or follow links in my signature so that I can grant the access right to the indicator.
Comment section is only for comments on the indicator or updates. Please refrain from contacting me using comments to follow TradingView house rules.
———————————————————————————————————————
多機能ストキャスティクスインジケーターです。以下の機能が搭載されています。
1.マルチタイムフレーム機能(表示時間足制御機能付き)
2.ダイバージェンス自動描画機能(ヒドゥンダイバージェンス対応)
3.%Kが%Dをクロスした時にシグナル表示(MTFの%Kと%Dでも同様)
4.%Kが%Dをクロスした時にアラート設定可能
機能詳細は以下の通りです。
機能詳細
1.マルチタイムフレーム機能(表示時間軸制御機能付き)
月足、週足、日足、4時間足、1時間足、30分足、15分足、5分足の中から一つを選択し、上位足のストキャスティクスとして表示することができます。(不要な場合は非表示可能)
他のマルチタイムフレームストキャスティクスとの違い
他のマルチタイムフレームストキャスティクスのインジケーターでは、以下の問題に直面します。
・上位足のストキャスティクスを表示すると、さらに上位足でもそのストキャスティクスが表示され見にくくなる。
例: 4時間足のストキャスティクスを下位足で表示可能な様に設定すると、日足や週足でも表示され、チャートが見にくくなる。
この問題に対して、このインジケーターでは、
・上位足のストキャスティクスを表示する時間軸を制御することで上位足で不必要な情報を表示させない。
という機能を加えることでこの問題を解決しています。
具体的には、マルチタイムフレーム用に選択した上位足のタイムフレームより小さいタイムフレームでのみ上位足のストキャスティクスが表示されるようになっています。
例えば、上位足として日足を選択した場合、日足のストキャスティクスは4時間足、1時間足、30分足、15分足、5分足、1分足にのみ表示されます。
<サンプルチャート>
左から4時間足、日足、週足です。
4時間足では日足のストキャスティクスが表示されていますが、週足には表示されません。
2.ダイバージェンス自動描画機能(ヒドゥンダイバージェンス対応)
以下のロジックに基づきダイバージェンスを自動描画します。(不要な場合は非表示可能)
<通常のダイバージェンス>
下降示唆: 2つの連続する高値(*)が切り上げられているが、 それぞれの高値に対応するストキャスティクスの値は切り下げている場合
上昇示唆: 2つの連続する安値(*)が切り下がっているが、 それぞれの安値に対応するストキャスティクスの値は切り上がっている場合
*高値(安値)は、左右n本(**)ずつのローソク足の高値(安値)より高い(低い)高値(安値)をピボットハイ・ローとして算出しています。
** nはユーザ設定値です。
<例: ダイバージェンス>
高値SH1はSH1のローソクの高値より左側にn個のより低い高値、右側にn個のより低い高値があった場合に高値として認識されます。
上記の例では高値がSH1>SH2と切り上がっていますが、対応する%Kの値はvalue2>value1と切り下がっているためダイバージェンスと認識されダイバージェンスラインが自動描画されます。
<ヒドゥンダイバージェンス>
下降継続示唆: 2つの連続する高値(*)が切り下がっているが、 それぞれの高値に対応するストキャスティクスの値は切り上がっている場合
上昇継続示唆: 2つの連続する安値(*)が切り上がっているが、 それぞれの安値に対応するストキャスティクスの値は切り下がっている場合
言うまでもないことですが、ダイバージェンスが出たから逆張り、などの安易な発想は避けるべきです。
環境認識の一つの要素として見るべき指標でしょう。
3.%Kが%Dとクロスした時にシグナル表示(MTFの%Kと%Dでも同様)
以下の条件を満たした時にシグナルを表示します。
-ロワーバンドより下で、%Kが%Dを上抜けた時
-アッパーバンドより上で、%Kが%Dを下抜けた時
-ロワーバンドより下で、%K(MTF)が%D(MTF)を上抜けた時
-アッパーバンドより上で、%K(MTF)が%D(MTF)を下抜けた時
4.%Kが%Dとクロスした時にアラート設定
以下の条件でアラート設定が可能です。
-ロワーバンドより下で、%Kが%Dを上抜けた時
-アッパーバンドより上で、%Kが%Dを下抜けた時
インジケーターの使用について
当インジケーターは招待制インジケーター(有料)となっています。
使用を希望される方はプライベートチャットや下記リンクのDMでご連絡ください。
このページのコメント欄はインジケーターそのものに対するコメントやアップデートの記載のためのものとなっております。Tradingviewのハウスルールを守るためにもコメント欄からの連絡はご遠慮ください。
