NN Trading SystemThis indicator is an attempt to be all-in-one solution that follows the structure of NNFX Youtube channel. The components may vary from trader to trader. This is my compilation. If you have any ideas to make it better, let me know.
Brief Info about the structure:
The trader chooses best indicators for the positions described below; enters and exits positions strictly based on the consensus of the indicators. Here are components:
1. Baseline (trend line): I usually use "Regression Line" indicator that can be found in the public library. If the price is above the baseline, look for longs; if the price is below the baseline, look for shorts. This part cannot be included in this indicator since it needs the indicator to be an overlay indicator. So choose and couple with your own.
2. Entry Signal: This is the main indicator that signals opening positions. I tested lots of indicators and finally chose LazyBear's MACD Leader Indicator. This is the modified version of it. When the signal line crosses over the zero line, it's a long signal. When the signal line crosses under the zero line, it's a short signal. You may also use the peaks of the hills it creates as a signal if you think it performs better. It's up to you. I have added dots for the possible peaks using "alma" cross algorithm.
3. Confirmation Signal #1: To open a position both the confirmation signals need to give a green signal. otherwise you are not allowed to open the position. Chosen indicator for this job is ATR. Set your minimum ATR value on the settings box and if the current ATR on the current timeframe is below the ATR value, a gray line will be drawn over the entry signal line and you should not take the trade. If you are already have a position, this doesn't mean that you should close the position though. It just informs you that momentum is low. YOU NEED TO ADJUST THIS ATR LIMIT FOR EVERY ASSET AND TIMEFRAME YOU TRADE. For BTC 1min, my example limit value is 8. Find your best value.
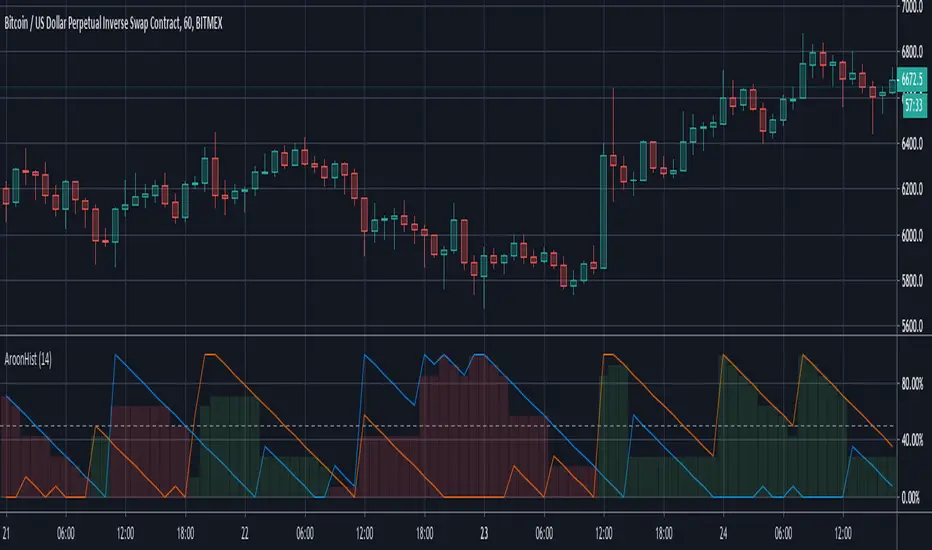
4. Confirmation Signal #2: I have chosen Aroon indicator for trend confirmations. If the background of the indicator is green, it's suitable for longs, if it's red, it's suitable for shorts. If the color is brighter, that means the signal is stronger. Aroon is a very powerful indicator but you need to find the best settings for the timeframe you are using.
5. Exit Signal: This one is the hardest role to find an indicator for. The one i ended up choosing is "Relative Vigor Index". It doesn't give good entry signals but with the right settings, it works as an exit signal in my experience. This signal is drawn as a green and red boxes and the top and the bottom of the indicator area. If it changes color while you have a position, it's time to close the position. Find the right settings for it so that every time it signals reversal, you obey the rule and close the position.
To summarise, the components are:
* ATR
* MACDL
* ALMA CROSSOVER
* AROON
* RVGI
plus
* a trend line indicator of your choice added seperately to your chart.
My recommendation is to turn all the indicators off on the settings box and enable on by one finding the best values individually. If you found the best settings for an asset and timeframe, please share in the comments for others.
You may leave a comment for bug reports, feedback and suggestions.
Hope it works for you.
Cheers.
Aroon

Jackrabbit.modulus.AROONThis is the AROON oscillator for the Jackrabbit suite and modulus framework.
This indicator supports differential timeframe analysis and confirmational bias. Dynamic timeframes are supported.
This is an updated view of AROON and supports traditional overbought/sold boundaries and cross over regions.
The main indicatior and the confirmational indicator can both be individually tuned for the length and smoothing, with 30 different moving average types:
SMA, Double SMA, Triple SMA,
EMA, Double EMA, Triple EMA,
RMA, Double RMA, Triple RMA
WMA, Double WMA, Triple WMA,
VWMA, Double VWMA, Triple VWMA,
Hull, Double Hull, Triple Hull,
ZLEMA, Double ZLEMA, Triple ZLEMA,
SWMA, Double SWMA, Triple SWMA,
SSMA, Double SSMA, Triple SSMA,
SMMA,Double SMMA, Triple SMMA
The Jackrabbit modulus framework is a plug in play paradigm built to operate through TradingView's indicator on indicatior (IoI) functionality. As such, this script receives a signal line from the previous script in the IoI chain, and evaluates the buy/sell signals appropriate to the current analysis. The results are either combined with the signal line, or used as confirmation to the signal line. A new signal line is generated for the next script in the link.
This script is not designed or meant to function outside my framework.
By default, the signal line is visible and the charts are turned off. Signal line visibility is controlled by the Style tab, and the charts display is controlled by the indicator settings tab.
This script is by invitation only. To learn more about accessing this script, please see my signature or send me a PM. Thank you.

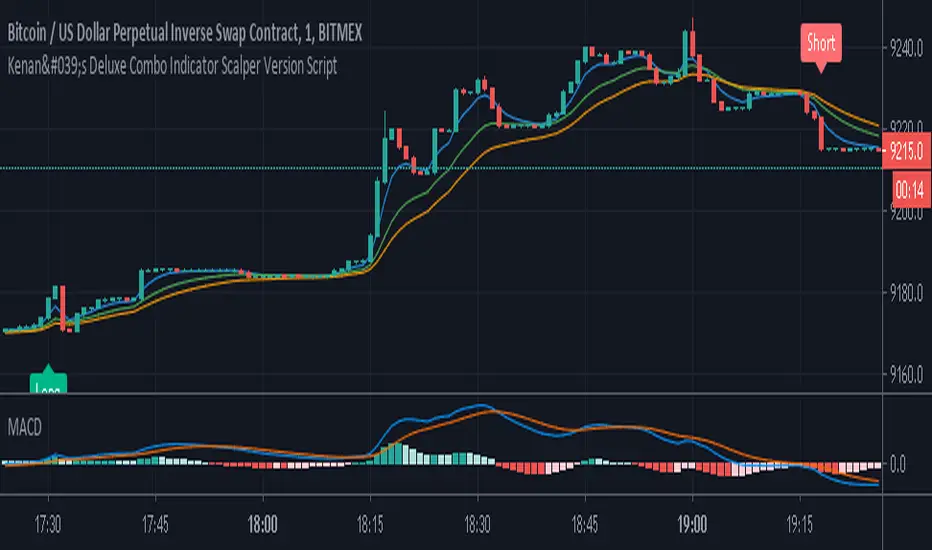
Kenan's Deluxe Combo Indicator Scalper Version ScriptThis is a combo strategy of sorts. I've been able to come up with this strategy after a lot of research.
Under Normal circumstances, when people look at dozens of indicators and they all signal, they open positions. So I decided to save people the trouble and put the major indicators together in a strategy.
All of the classic cross strategies usually give a lot of signal. Some of these signals are unnecessary and incorrect signals. Combining leading indicators. I tried to avoid the faulty signals.
Indicators and oscillators included in this strategy are:
1. Ema 5/13/21
2. Macd
3. Macd Dema
4. Ichimoku
5. Dmi
6. Stochastic
7. Aroon
8. Bollinger Band
9. Rsi
10. Chande Momentum Oscillator
11. Exponential Ease of Movement ( Eom )
12. Klinger Oscillator
13. Stochastic RSI
14. Ultimate Oscillator
15. Woodies CCI
16. Rate Of Change Lenght( Roc ) oscillator
17. WaveTrend Oscillator . It was created by @fskrypt.
18. Ehlers Adaptive CG Indicator . It was created by @LazyBear
19. Insync Index. It was created by @LazyBear
This script works by listening to the indicators and oscillators above. Opens new position after receiving signal verification signal from all
So how does this strategy close your position (optional).
1. You can close the position with the trailing stop option.
2. You can close the position according to the Rsi limits. To give an example. After a long position is opened, you can close the position after the rsi has risen above 70.
3. You can close the position according to the Bollinger Band . After a position is opened, you can close the position after the price moves out of the bollinger Band .
You can also change the values of indicators as desired. If you get better results. I would appreciate it if you could contact me via comment or private message.
I set the commission rate at 0.075 percent. If you want, you can change the settings yourself and make backtest.I changed the default settings for some indicators.
Kenan's Deluxe Combo Indicator Scalper Version StrategyThis is a combo strategy of sorts. I've been able to come up with this strategy after a lot of research.
Under Normal circumstances, when people look at dozens of indicators and they all signal, they open positions. So I decided to save people the trouble and put the major indicators together in a strategy.
All of the classic cross strategies usually give a lot of signal. Some of these signals are unnecessary and incorrect signals. Combining leading indicators. I tried to avoid the faulty signals.
Indicators and oscillators included in this strategy are:
1. Ema 5/13/21
2. Macd
3. Macd Dema
4. Ichimoku
5. Dmi
6. Stochastic
7. Aroon
8. Bollinger Band
9. Rsi
10. Chande Momentum Oscillator
11. Exponential Ease of Movement ( Eom )
12. Klinger Oscillator
13. Stochastic RSI
14. Ultimate Oscillator
15. Woodies CCI
16. Rate Of Change Lenght( Roc ) oscillator
17. WaveTrend Oscillator . It was created by @fskrypt.
18. Ehlers Adaptive CG Indicator . It was created by @LazyBear
19. Insync Index. It was created by @LazyBear
This script works by listening to the indicators and oscillators above. Opens new position after receiving signal verification signal from all
So how does this strategy close your position (optional).
1. You can close the position with the trailing stop option.
2. You can close the position according to the Rsi limits. To give an example. After a long position is opened, you can close the position after the rsi has risen above 70.
3. You can close the position according to the Bollinger Band . After a position is opened, you can close the position after the price moves out of the bollinger Band .
You can also change the values of indicators as desired. If you get better results. I would appreciate it if you could contact me via comment or private message.
I set the commission rate at 0.075 percent. If you want, you can change the settings yourself and make backtest.I changed the default settings for some indicators.

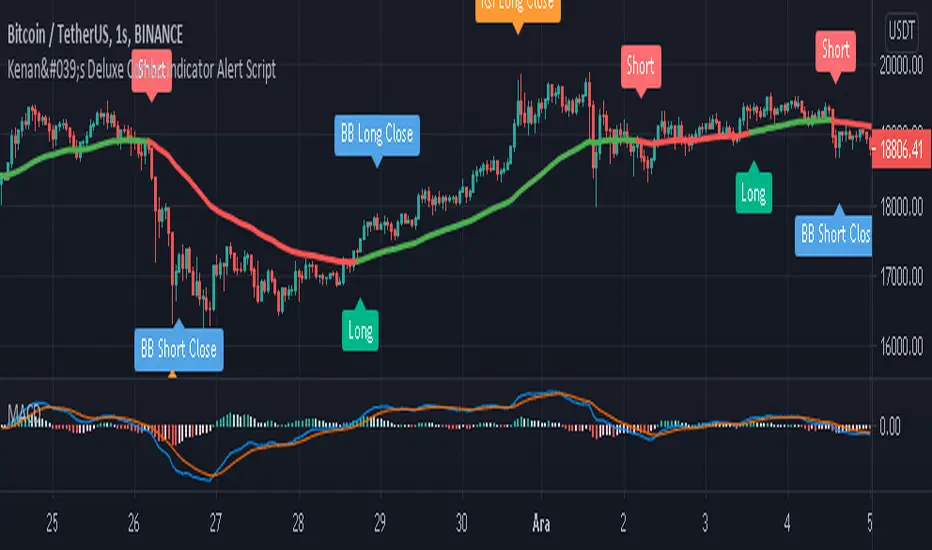
Kenan's Deluxe Combo Indicator Alert ScriptThis is a combo strategy of sorts. I've been able to come up with this strategy after a lot of research.
Under Normal circumstances, when people look at dozens of indicators and they all signal, they open positions. So I decided to save people the trouble and put the major indicators together in a strategy.
All of the classic cross strategies usually give a lot of signal. Some of these signals are unnecessary and incorrect signals. Combining leading indicators. I tried to avoid the faulty signals.
Indicators and oscillators included in this strategy are:
1. Ema 5/13/21
2. Macd
3. Macd Dema
4. Ichimoku
5. Dmi
6. Stochastic
7. Aroon
8. Bollinger Band
9. Rsi
10. Chande Momentum Oscillator
11. Exponential Ease of Movement ( Eom )
12. Klinger Oscillator
13. Stochastic RSI
14. Ultimate Oscillator
15. Woodies CCI
16. Rate Of Change Lenght( Roc ) oscillator
17. WaveTrend Oscillator . It was created by @fskrypt.
18. Ehlers Adaptive CG Indicator . It was created by @LazyBear
19. Insync Index. It was created by @LazyBear
This script works by listening to the indicators and oscillators above. Opens new position after receiving signal verification signal from all
So how does this strategy close your position (optional).
1. You can close the position with the trailing stop option.
2. You can close the position according to the Rsi limits. To give an example. After a long position is opened, you can close the position after the rsi has risen above 70.
3. You can close the position according to the Bollinger Band . After a position is opened, you can close the position after the price moves out of the bollinger Band .
You can also change the values of indicators as desired. If you get better results. I would appreciate it if you could contact me via comment or private message.
I set the commission rate at 0.075 percent. If you want, you can change the settings yourself and make backtest.I changed the default settings for some indicators.
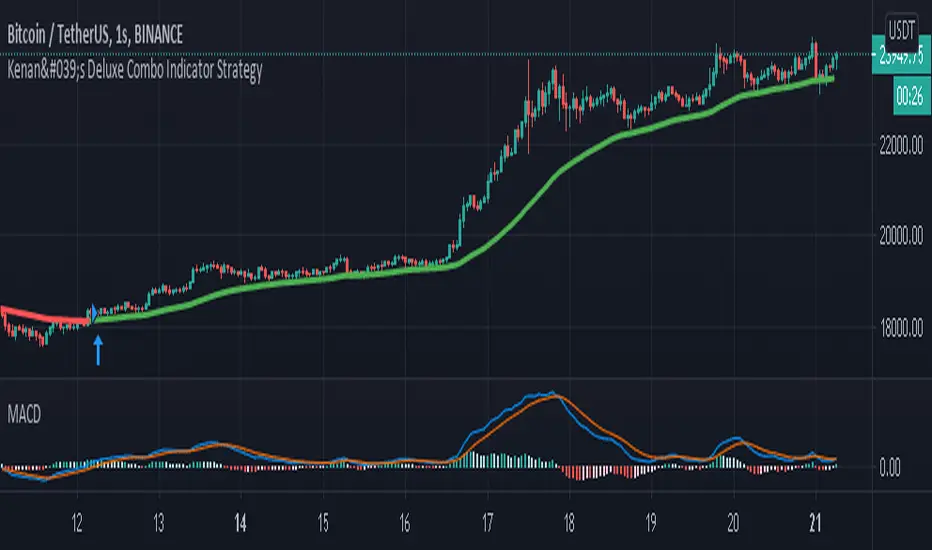
Kenan's Deluxe Combo Indicator StrategyThis is a combo strategy of sorts. I've been able to come up with this strategy after a lot of research.
Under Normal circumstances, when people look at dozens of indicators and they all signal, they open positions. So I decided to save people the trouble and put the major indicators together in a strategy.
All of the classic cross strategies usually give a lot of signal. Some of these signals are unnecessary and incorrect signals. Combining leading indicators. I tried to avoid the faulty signals.
Indicators and oscillators included in this strategy are:
1. Ema 5/13/21
2. Macd
3. Macd Dema
4. Ichimoku
5. Dmi
6. Stochastic
7. Aroon
8. Bollinger Band
9. Rsi
10. Chande Momentum Oscillator
11. Exponential Ease of Movement ( Eom )
12. Klinger Oscillator
13. Stochastic RSI
14. Ultimate Oscillator
15. Woodies CCI
16. Rate Of Change Lenght( Roc ) oscillator
17. WaveTrend Oscillator . It was created by @fskrypt.
18. Ehlers Adaptive CG Indicator . It was created by @LazyBear
19. Insync Index. It was created by @LazyBear
This script works by listening to the indicators and oscillators above. Opens new position after receiving signal verification signal from all
So how does this strategy close your position (optional).
1. You can close the position with the trailing stop option.
2. You can close the position according to the Rsi limits. To give an example. After a long position is opened, you can close the position after the rsi has risen above 70.
3. You can close the position according to the Bollinger Band . After a position is opened, you can close the position after the price moves out of the bollinger Band .
You can also change the values of indicators as desired. If you get better results. I would appreciate it if you could contact me via comment or private message.
I set the commission rate at 0.075 percent. If you want, you can change the settings yourself and make backtest.I changed the default settings for some indicators.
Trend-Following Combo-SuperTrend, EMA, Aroon, DMI, Laguerre RSIThis is a trend-following indicator which condenses two SuperTrend indicators -- one based on analysis over a shorter period of time (1.5, 7), and one based on analysis over a longer period of time (1.65, 100) -- into a single indicator which appears on your chart only when both the shorter- and longer-term analysis indicates a "SuperTrend" in the same direction.
Additionally, potential trade entry indicators are displayed in the form of up and down arrows when (by default) three of the following five indicators suggest that the market is trending in the same direction as both the shorter- and longer-term SuperTrend indicators:
EMA Crossover (8, 15)
Aroon Indicator (8)
Aroon Oscillator (8)
Directional Movement Index (DI +/-) (8)
Laguerre RSI (13)
You may update the parameters of any of the indicators to match your own preferences.
Additionally, you may also adjust the "Threshold" of indicators that must be in agreement with the SuperTrend to show a potential trade entry arrow. Bear in mind that if you set the Indicator Threshold too low, you will see more frequent trade entry arrows, many of which will not be profitable if taken. Similarly, set this value too high, and you will see fewer trade entry arrows that may not appear until after most of the "juice" in the trend has evaporated. Ideal values for the threshold seem to be between 2-4, depending on the symbol you are trading.
The following image shows all of the indicators referenced above on a 5-minute chart of the SPY during a single trading day:
And, here is the same period of time showing only the Trend-Following Combo indicator with default settings:
This indicator would not have been possible save for work contributed by the following:
SuperTrend by Rajandran R
Aroon w/ crossovers highlighted by seiglerj
Aroon Oscillator by jcrewolinsky
Directional Movement Index by TradingView
Laguerre RSI (Self Adjusting Alpha with Fractals Energy) by everget

(3) AROON VS-31We include the Aroon Oscillator in our indicators for two reasons; 1. because of its value as a screening tool outside of the Tradingview environment, and 2. because of its value in detecting trends, trend strength and ultimately the end of a trend. The Aroon Oscillator was developed by Tushar Chande to highlight the start of a new trend and to measure trend strength. Chande first described the indicator in the September 1995 issue of Stocks & Commodities magazine. Our version of the indicator also includes the volume alert flags that all Genie indicators include. Aroon determines if the most recent highs or lows were the highest or the lowest for the period of time the indicator is set to. Higher Aroon values indicate more recent highs and lows, while lower values indicate less recent highs and lows. Aroon values oscillate between 0 and 100, with a higher number indicating a stronger trend and a low number the lack of a trend.
Aroon and MoTrend provide cross conformation and validation of a new trend trading opportunity.
Alerts to signal High / Low crossover events are included within the indicators code.
Access this Genie indicator for your Tradingview account, through our web site. (Links Below) This will provide you with additional educational information and reference articles, videos, input and setting options and trading strategies this indicator excels in.

Aroon Histogram + CMO Multiple Time Frames [ChuckBanger]This script is based on my Aroon Histogram + CMO:
But it has the option to use it multiple time frames to automatically check for bull and bear crossover on CMO and it has the ability for the trader to set alert on crossovers

Aroon Oscillator strategy by SauciusThis strategy suits better for stock, indexes and commodities sufficiently volatile but with not so strong trend, where perspective of future quotations are not so certain.
For these financial instruments this system works better than others based on classical trend oscillator (like Supertrend)
This strategy starts from the idea of the creator of Aroon lines, Tushar Chande, whose suggested to an unique Aroon Oscillator (defined as Aroon Up - Aroon Down), instead of 2 lines (for reference, original article avaible in:" Stocks & Commodities , V. 13:9 : A Time Price Oscillator by Tushar Chande, Ph .D."" - paragraph: "more patterns").
Use middle line for taking position, and the extreme ones (high and low) for exiting from long/short position. Extreme lines are not use for opening position against the trend.
Best values are for EU stocks and indexes: 19 periods, middle line = - 25 (ecxpecially for shares, give the general tendency of growing). Therefore also levels for exiting long/short position are not specular (levelhigh stops at + 75, low at -85 since stocks when go down, fall often heavily)
Please give feedback for improving this strategy! All the best,
MS .

The Extensive IndicatorThe extensive Indicator reads many kinds of signals and price movements.
Basically,
Long ==> Plus symbol (+) is green and at least 2 other symbols are green ### stop loss when plus symbol is red and any 2 other symbols are red.
Short ==> Plus symbol (+) is red and at least 2 other symbols are red ### stop loss when plus symbol is green and any 2 other symbols are green.

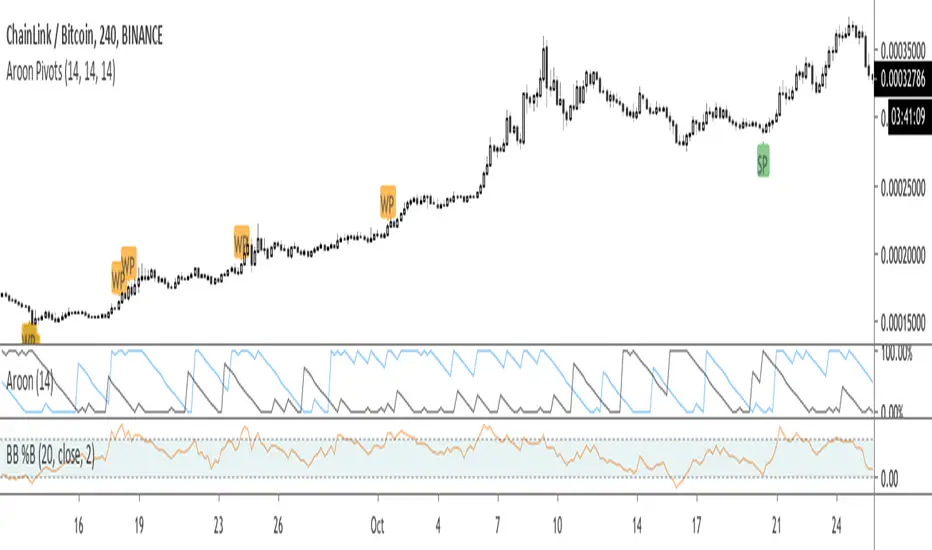
Aroon Pivots Beta 2.0THIS IS A BETA AND ONLY TO BE USED FOR TESTING PURPOSES
Upgraded Beta Version of the Aroon Pivots Beta.
PLEASE READ BELOW OF THE USAGE OF PIVOTS
Whats new in 2.0?
- Updated to a new Script: This is for two reasons (1) there have been some overall changed to the weaker signals to make then stronger and felt it was changed enough to differentiate and be able for beta testers to compare side by side, and (2) some users have had issues using the script and getting an error, which this hopefully fixes.
- Improved accuracy for the "weak" signals
- Color coded "strong" and "week signals and now renamed to set them apart as "SP" and "WP" respectively.
- Added confluence to signals to help improve all timeframes.
This script is the beta version of the Aroon Pivots for testing purposes and is not intended to be used in real trading.
========= AROON PIVOTS =========
The purpose of this script is to use the power of the Aroon Lines to determine when trends or portions of a trend have reached a certain level of exhaustion, which in turn can help discover pivot points or reversals. Aroon Lines (the Up and Down lines) are measures of time that compare previous highs and lows, as well as opens and closes, which when compared can give insight on a possible incoming trading move. Aroon is one of the few indications that was designed for this purpose to show possible moves instead of historic data.
========= HOW TO USE =========
It's fairly simple, but small labels are created that show when entry or exit is at its closing peak. Labels can be used to enter as a maximum opportunity in addition to minimal risk, while simultaneously can be used to close an already open position for maximum closing results.
========= ADDITIONAL NOTES =======
- Labels are printed when the criteria is met, however, the labels are not fully realized until candle close.
- Labels are not repainted.
- Labels are specific to their relative timeframe, so its expected that a lower timeframe pivot will not expand into a high timeframe label, especially is the labels are giving opposite pivots .
Aroon Pivots BetaThis script is the beta version of the Aroon Pivots for testing purposes and is not intended to be used in real trading.
========= AROON PIVOTS =========
The purpose of this script is to use the power of the Aroon Lines to determine when trends or portions of a trend have reached a certain level of exhaustion, which in turn can help discover pivot points or reversals. Aroon Lines (the Up and Down lines) are measures of time that compare previous highs and lows, as well as opens and closes, which when compared can give insight on a possible incoming trading move. Aroon is one of the few indications that was designed for this purpose to show possible moves instead of historic data.
========= HOW TO USE =========
It's fairly simple, but small labels are created that show when entry or exit is at its closing peak. Labels can be used to enter as a maximum opportunity in addition to minimal risk, while simultaneously can be used to close an already open position for maximum closing results.
========= ADDITIONAL NOTES =======
- Labels are printed when the criteria is met, however, the labels are not fully realized until candle close.
- Labels are not repainted.
- Labels are specific to their relative timeframe, so its expected that a lower timeframe pivot will not expand into a high timeframe label, especially is the labels are giving opposite pivots.
Version 0.0.1

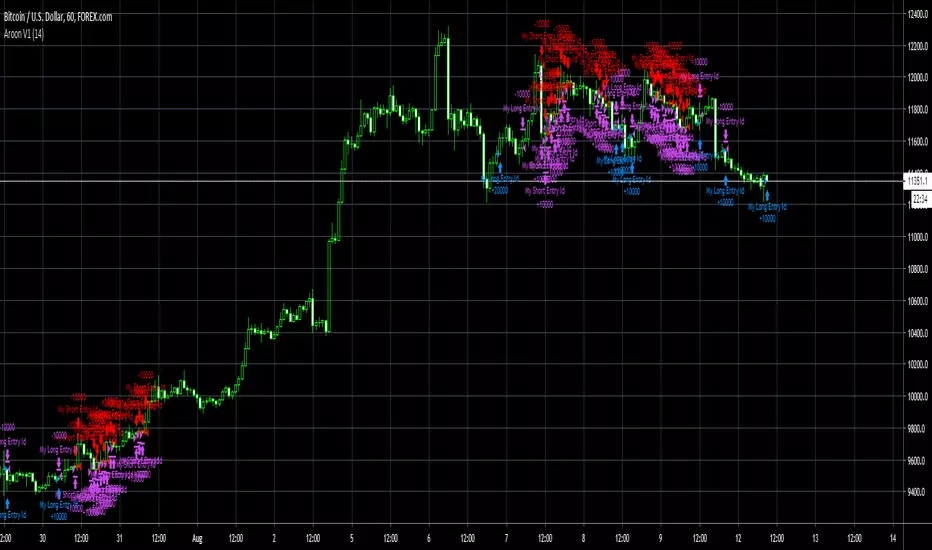
Aroon V1Aroon V1
uses two aroons,
buy: UpperAroon0 > UpperAroon1 and UpperAroon0 < lowerAroon0 and UpperAroon1 < lowerAroon1
sell: UpperAroon0 < UpperAroon1 and UpperAroon0 > lowerAroon0 and UpperAroon1 > lowerAroon1
trailing stop
50pip tp
no sl
Highly Optimized (Aroon, DMI, RWI)It is a highly optimized script for H4, D1. Backtests from (2016 - 2019, depending on the currency pair). Optimization still
going on.
Following alerts can be activated:
-
Buy-Signal (Baseline-Cross)!
Sell-Signal (Baseline-Cross)!
Buy Signal (Aroon)!
Sell Signal (Aroon)!
Buy Signal (DMI)!
Sell Signal (DMI)!
Buy Signal (RWI)!
Sell Signal (RWI)!
Can be used by the following pairs:
AUDCAD
AUDCHF
AUDJPY
AUDNZD
AUDSGD
AUDUSD
CADCHF
CADJPY
CHFJPY
CHFSGD
EURAUD
EURCAD
EURCHF
EURGBP
EURJPY
EURNZD
EURSGD
EURTRY
EURUSD
GBPAUD
GBPCAD
GBPCHF
GBPJPY
GBPNZD
GBPSGD
GBPUSD
NZDCAD
NZDCHF
NZDJPY
NZDUSD
SEKJPY
SGDJPY
USDCAD
USDCHF
USDCNH
USDJPY
USDSGD
USDTRY
XRPUSD
Price is 5€ per Month or 75€ lifetime. One week free for testing.

Aroon 3 EMA cross 3 EMA Cross 5 15 and 30 combined with Aroon Indicator,
Red Arrow -> Short
Green Arrow -> Long
Blue Cross -> Close

Time Price IndicatorIntroduction
There are already several indicators who measure the time behavior relative to price, the most well know being the Aroon indicator published by Tushar Chande. I propose an alternative indicator TPI who tend to create less whipsaw's at the cost of small reactivity.
The Indicator
The TPI is in a range of 0.5/-0.5 and is no different than the Aroon indicator when it come to signal generation, when the upper line (in blue) crossover the lower line (in orange) the indicator generate a buy signal, when the lower line cross under the upper line a sell signal is generated.
Comparison
The Aroon indicator tend to use more information which involve more reactivity but more uncertainty as well.
Aroon and TPI with both length = 50. White lines represent signals where the Aroon and my proposed indicator react at the same time, the red line show a whipsaw and the green line show a signal generated faster by the Aroon.
Here is a more pertinent exemple
Aroon reacted to price range which at the end involved many whipsaw, the TPI however stayed on a sell signal and did not reacted to this price range. The cost to avoid so many whipsaw was a reactivity of 7 bars back when the sell signal of the TPI was generated.
A statistic of the signal numbers generated by both indicator is shown below
The blue line show the number of signals generated by the Aroon indicator and in orange the number generated by the TPI with both length = 14. Aroon generated 410 while the TPI generated 288 signals.
Conclusion
The Aroon indicator and TPI can both generate a signal at the same time or with a small period deviation with the ability of the TPI to avoid some whipsaw.

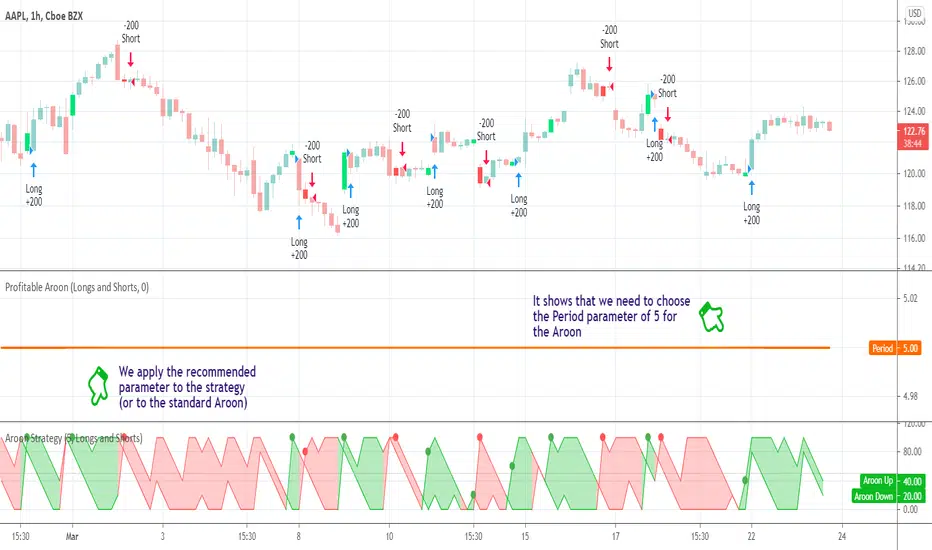
Profitable AroonIntroduction
The Aroon indicator was developed by well-known technical analyst Tushar Chande in 1995 and is used to identify trend changes in the price of an asset, as well as the strength of that trend. The fact that he named the indicator "Aroon" which is Sanskrit for "Dawn’s Early Light" demonstrates his belief in his indicator's trend discovery capabilities.
It is composed of two lines, Aroon Up and Aroon Down .
The most basic strategy is to use the crossovers as trade signals:
when Aroon Up crosses above Aroon Down , go Long
when Aroon Down crosses above Aroon Up , go Short
Exit when a crossover occurs in the opposite direction
What is this tool?
This tool is a performance scanner that uses a decision tree-based algorithm under the hood to find the most profitable period setting for the Aroon. It analyzes the range of periods between 2 to 100 and backtests the Aroon indicator for each period using the strategy mentioned above across the entire history of an instrument. If a more profitable parameter was found, the indicator will switch its value to the found one immediately.
Alerts
It has an alert that notifies when a more profitable period was found.
NOTE : It does not change what has already been plotted.
Good luck and Happy Trading!
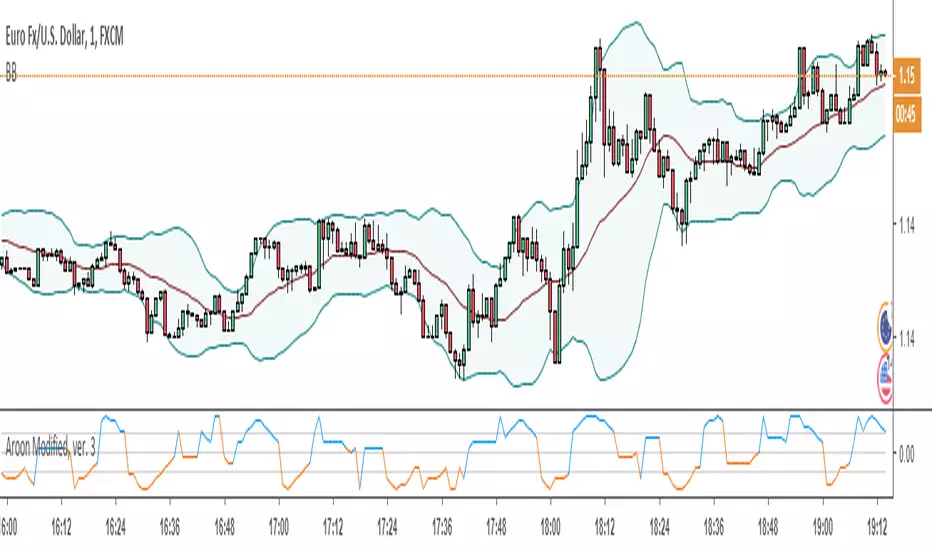
Aroon Modified, ver. 3Several views of Aroon Indicator - original, binarized, smoothed and differenced.
More 'readable' variations of this indicator will help to appreciate its role and integrate into trading strategies more readily.
***Added differenced Aroon view as well as corrected minor shortcomings***
Aroon Modified: binarized and smoothedThree views of Aroon Indicator - original, binarized and smoothed.
More 'readable' variations of this indicator will help to appreciate its role and integrate into trading strategies more readily.
Note that the smoothed Aroon can be viewed as a channel indicator when normalized to price series.

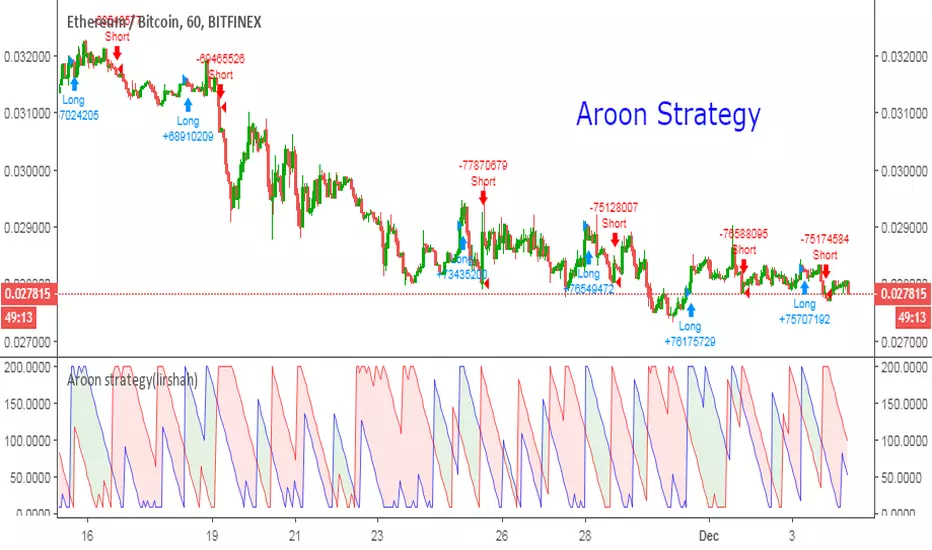
Aroon strategy(lirshah)The Aroon indicator is a technical indicator that is used to identify when trends are likely to change direction.
In essence, the indicator measures the time it takes for the price to reach the highest and lowest points over a given timeframe as a percentage of total time.
The indicator consists of the "Aroon up" line, which measures the strength of the uptrend, and the "Aroon down" line, which measures the strength of the downtrend.
this strategy has been written based on the movement of this two lines and has a notable results on major crypto pairs, ETHUSD, ETHBTC,BTCUSD,XBTUSD and ...
Cronos Trend Aroon by Zekis"The Aroon indicator is a technical indicator that is used to identify when trends are likely to change direction. In essence, the indicator measures the time it takes for the price to reach the highest and lowest points over a given timeframe as a percentage of total time. The indicator consists of the "Aroon up" line, which measures the strength of the uptrend, and the "Aroon down" line, which measures the strength of the downtrend."
Classic Aroon indicator with few changes:
1. Colors for trends: red line and red background = downtrend
green line and green background = uptrend
2. Crossover is signaled with an yellow stripe
3. Alerts are enabled for longs/entries and shorts/exits
Enjoy!
@ Zekis
